PU Prime App
Exclusive deals on mobile


PU Prime App
Exclusive deals on mobile
Hold The Global Markets In Your Hands
Our trading mobile app is compatible with most smart devices. Download the App now and start trading with PU Prime on any device, anytime and anywhere.


17 October 2023,06:00
Daily Market Analysis
17 October 2023, 06:00

Amid escalating Middle East tensions, Western allies have intensified diplomatic efforts. U.S. President Joe Biden’s upcoming visit to Israel signals a show of support, bolstering market confidence. Equities surged, reflecting improved risk appetite, while traditional safe-havens like USD and gold dipped for the second consecutive session. Despite a slight easing, oil prices found stability above $86. As the earnings season unfolds, U.S. equity markets are poised for heightened volatility. Analysts anticipate challenging reports, influenced by elevated borrowing costs throughout the year.
Current rate hike bets on 1st November Fed interest rate decision:
Source: CME Fedwatch Tool
0 bps (88.0%) VS 25 bps (12%)
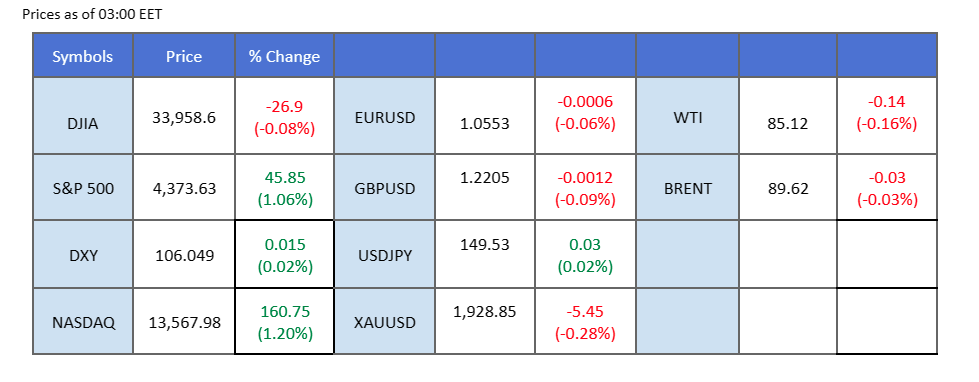
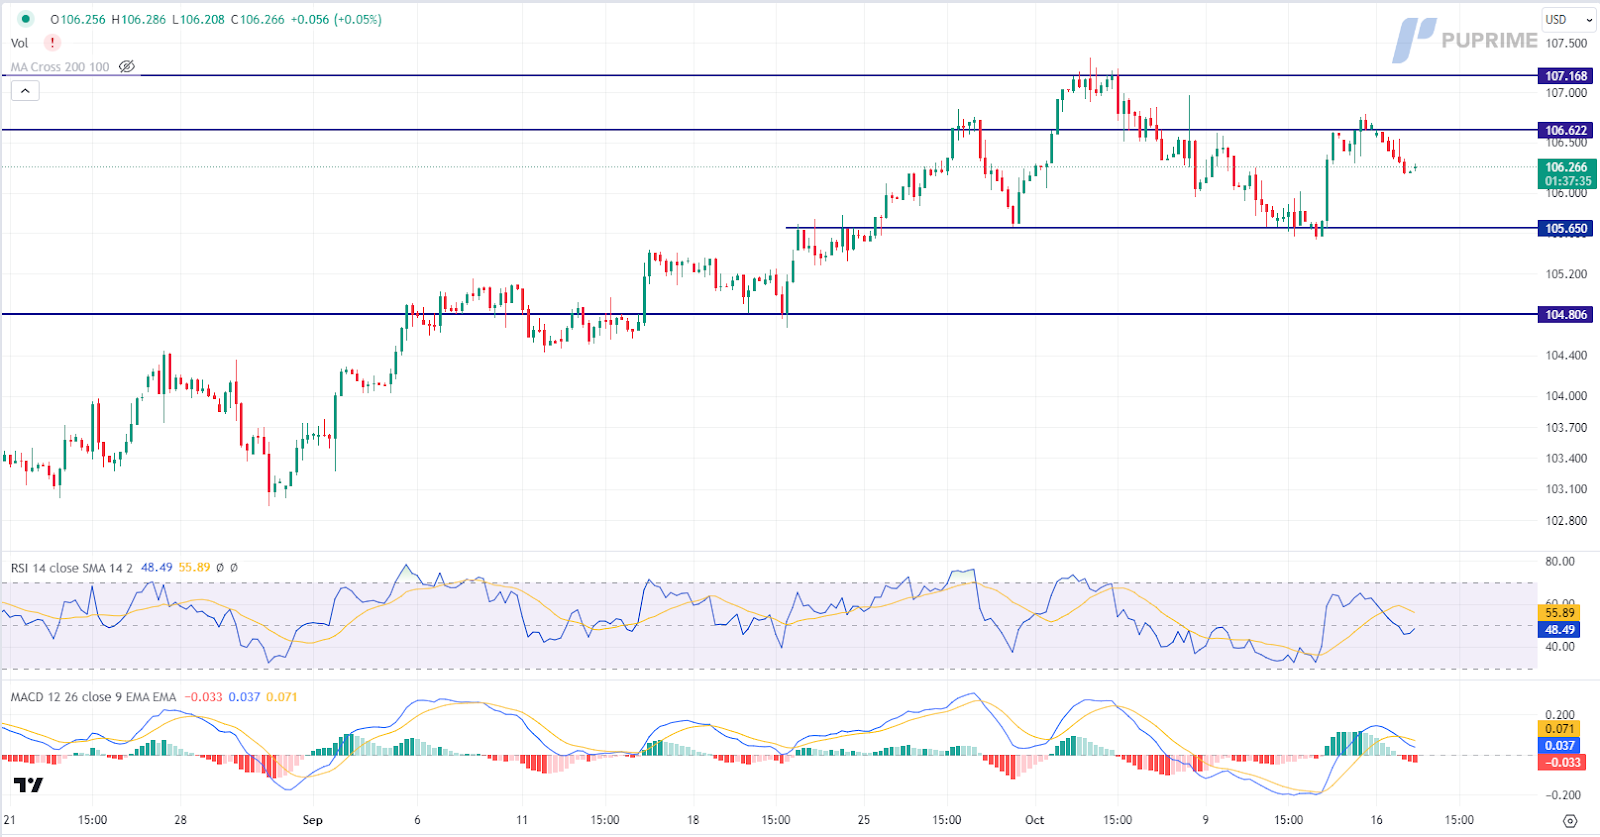
The US Dollar saw a period of consolidation as profit-taking ensued following its recent highs. Market attention now centres on upcoming crucial economic data releases, particularly core retail sales and retail sales, to gain insights into the US economy’s trajectory.
The Dollar Index is trading lower following the prior retracement from the resistance level. MACD has illustrated increasing bearish momentum, while RSI is at 49, suggesting the index might extend its losses toward support level since the RSI stays below the midline.
Resistance level: 106.60, 107.15
Support level: 105.65, 104.80
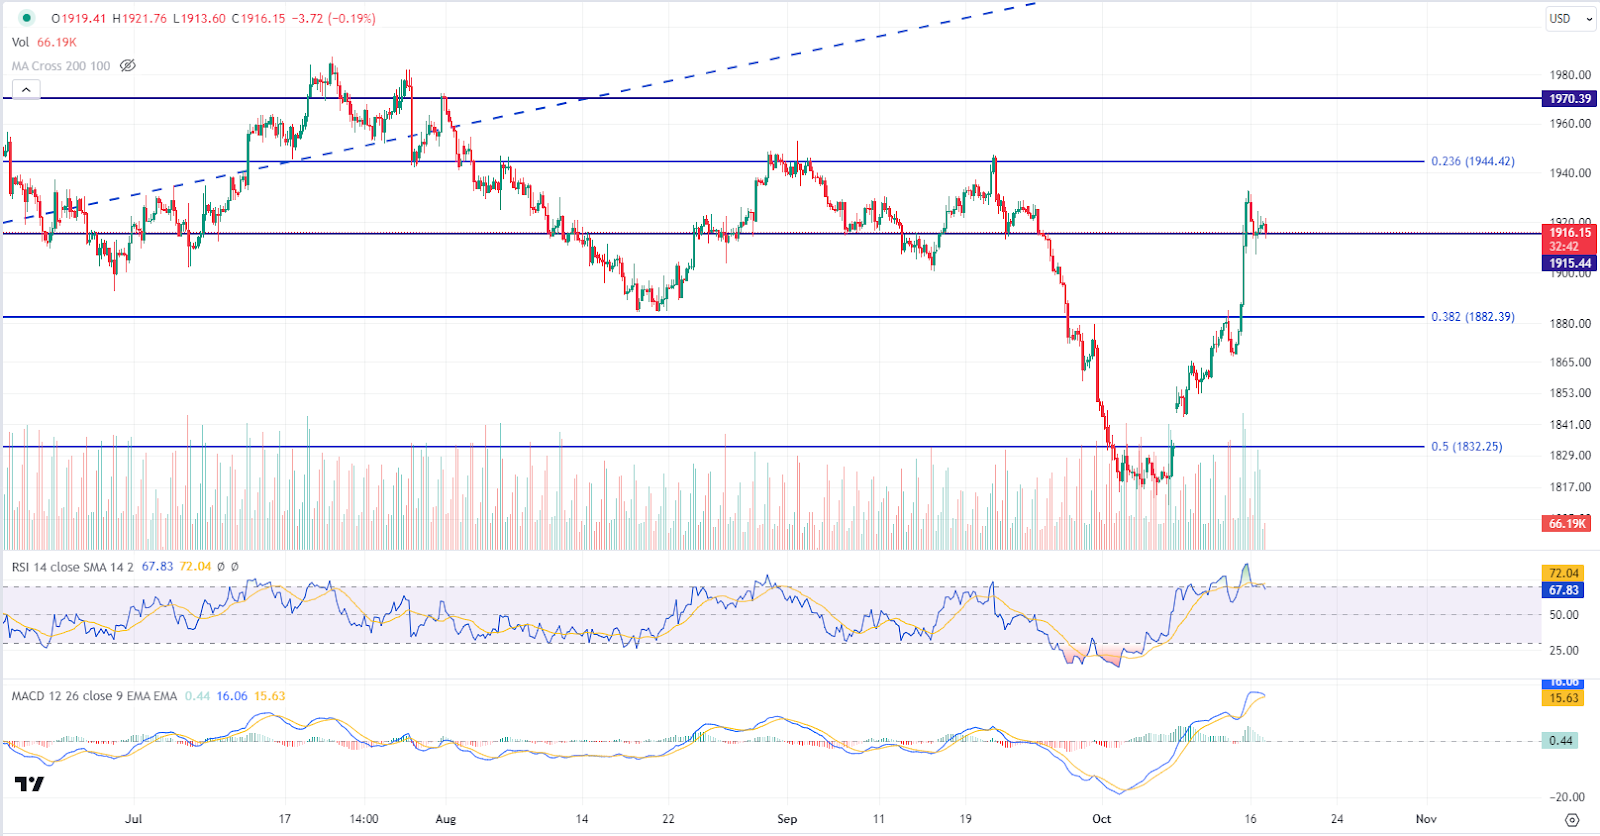
After experiencing a significant surge last week due to rising tensions in the Middle East, gold prices retreated slightly as investors booked profits. However, with the Israel-Hamas conflict ongoing, and the potential for further international involvement, the safe-haven appeal of gold remains strong, with all eyes on geopolitical developments.
Gold prices are trading lower while currently testing the support level. MACD has illustrated diminishing bullish momentum, while RSI is at 67, suggesting the commodity might enter overbought territory.
Resistance level: 1945.00, 1970.00
Support level: 1915.00, 1880.00
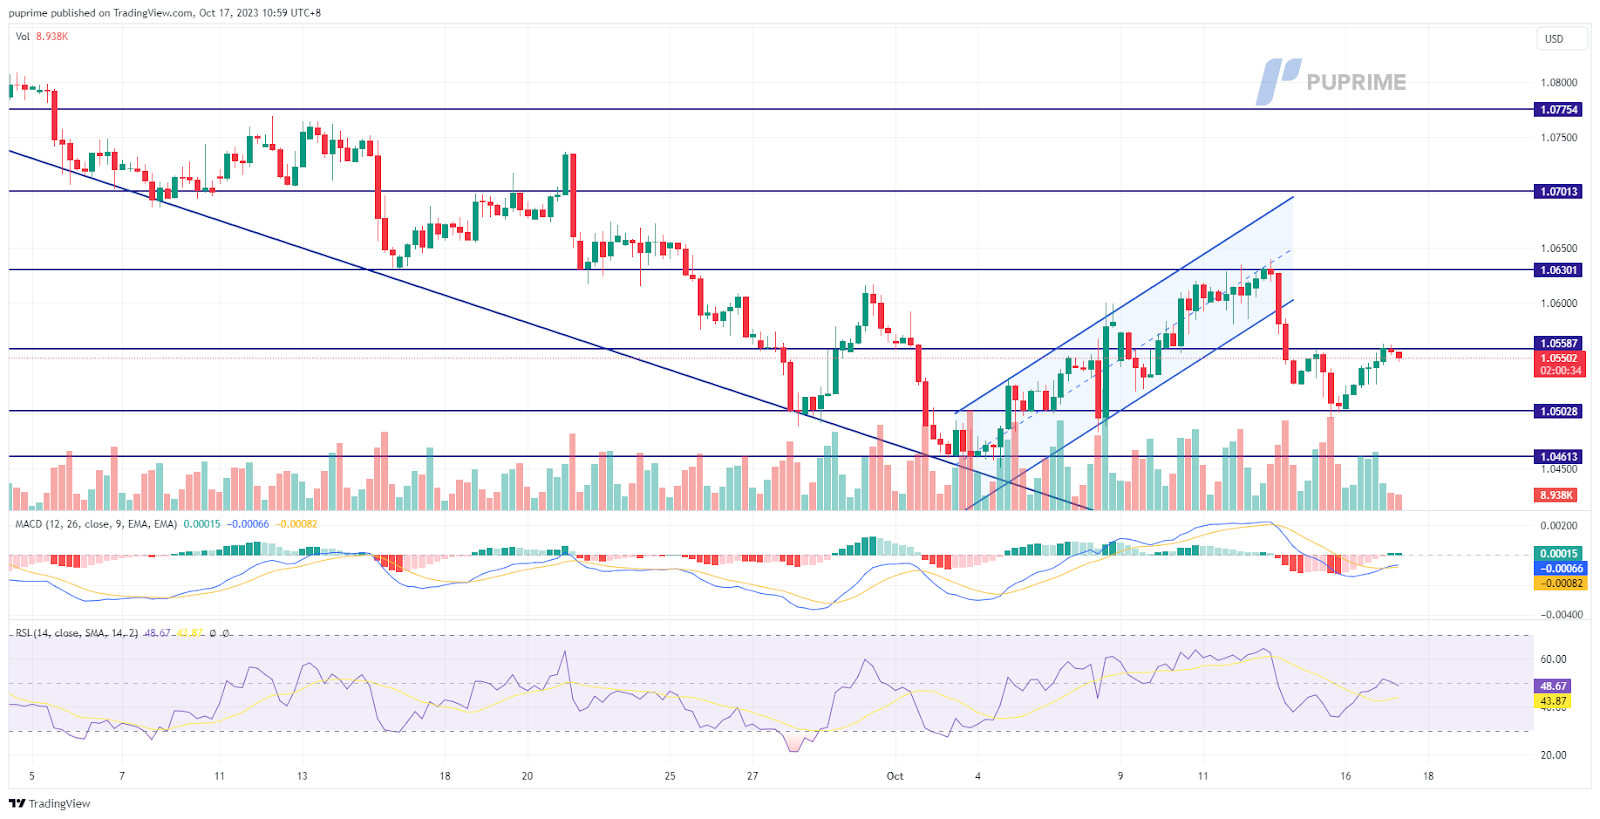
The EUR/USD pair maintains its upward momentum, driven by diplomatic efforts to ease Middle East tensions and reduce demand for the safe-haven USD. Despite this, the euro faces resistance at 1.0560. Market attention shifts to the eurozone’s upcoming CPI data, with expectations of a decline from previous readings, potentially leading to depreciation against the robust USD.
EUR/USD rebounded strongly by 0.5% yesterday but is suppressed under its strong resistance level at 1.0560. The MACD has crossed while the RSI has a sign of rebound, suggesting the bearish momentum has vanished.
Resistance level: 1.0630, 1.0750
Support level: 1.0500, 1.0460

The ongoing apprehension regarding potential monetary intervention by the Bank of Japan is currently strengthening the Japanese yen. The recent discussion among policymakers about the need for possible intervention on the Japanese yen reflects their concerns over its trajectory. Any moves by the Bank of Japan to intervene could further bolster the yen and consequently lead to a continued decline in the USD/JPY pair.
USD/JPY is trading lower following the prior retracement from the resistance level. MACD has illustrated increasing bearish momentum, while RSI is at 56, suggesting the pair might extend its losses since the RSI retreated sharply from overbought territory.
Resistance level: 149.95, 151.45
Support level: 148.40, 147.30

US equity markets inched higher as investors increased bullish bets on big tech companies in anticipation of forthcoming financial reports from major corporations. Attention has shifted from US Treasury yields to quarterly earnings from influential players like big banks, Netflix, and Tesla this week.
The Dow is trading higher following the prior breakout above the resistance level. MACD has illustrated increasing bullish momentum, while RSI is at 59, suggesting the index might extend its gains since the RSI stays above the midline.
Resistance level: 34355.00, 34900.00
Support level: 33900.00, 33370.00
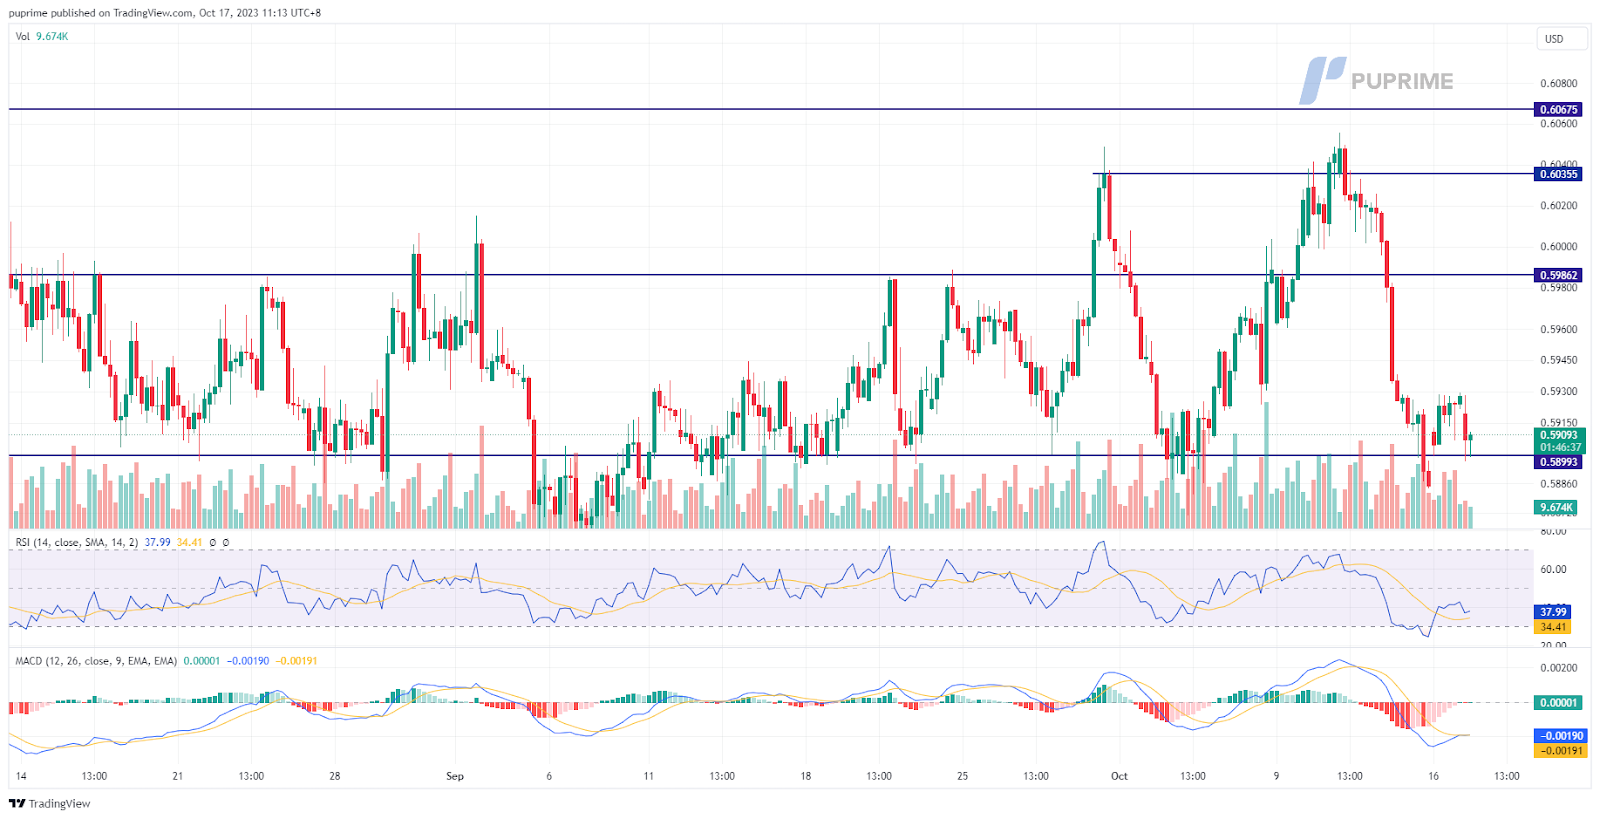
The Kiwi faced a sharp decline amid a robust USD, fueled by heightened Middle East tension. Despite positive sentiment following the recent New Zealand general election, the Kiwi failed to gain traction. Additionally, New Zealand’s disappointing CPI data indicates easing inflation, potentially paving the way for a more dovish monetary policy stance from the RBNZ.
NZD/USD is currently buoyed by its strong support level at 0.5890 but macroeconomic factors hinder the technical rebound momentum. The RSI and the MACD continue to hover in the lower region, suggesting the bearish momentum is still strong.
Resistance level: 0.5980, 0.6060
Support level: 0.5890, 0.5800
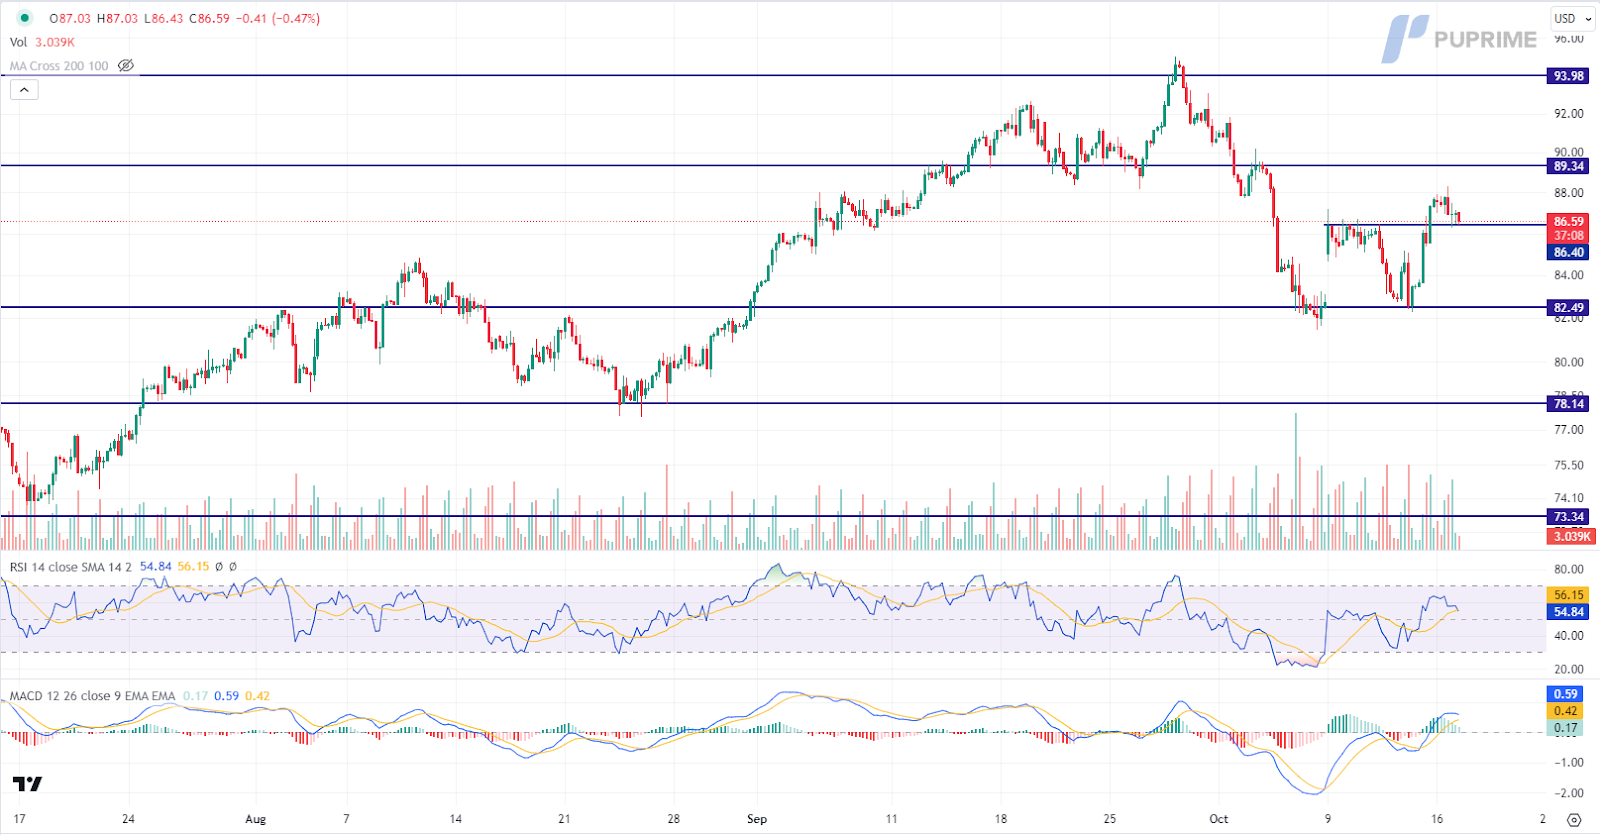
The oil market witnessed a slight decline as hopes for potential sanction relief for Venezuela emerged. Talks between Venezuela’s government and the opposition have the potential to lead to a relaxation of sanctions on the country, which could increase its oil exports and alleviate pressure on the global crude market.
Oil prices are trading lower while currently testing the support level. MACD has illustrated diminishing bullish momentum, while RSI is at 55, suggesting the commodity might extend its losses after breakout since the RSI retreated sharply from overbought territory.
Resistance level: 89.35, 94.00
Support level: 86.40, 82.50

Trade forex, indices, metal, and more at industry-low spreads and lightning-fast execution.
Sign up for a PU Prime Live Account with our hassle-free process.
Effortlessly fund your account with a wide range of channels and accepted currencies.
Access hundreds of instruments under market-leading trading conditions.
Trading Platforms
Education
Company
FAQs
PU Prime App - Start Trading with an Edge


Risk Warning: Trading Contract for Difference (CFD) carries a high level of risk to your capital and may result in losses that exceed your deposits due to leverage. It's important to understand how CFDs work and assess whether you can afford the high risk of losing your money. When acquiring our derivative products, you do not own or have rights in the underlying assets. Past performance is not indicative of future results. The information on this website is general and does not take into account your personal objectives, financial circumstances, or needs. Seek independent advice from qualified experts if necessary, and ensure you fully understand the risks before making any trading decisions.
PU Prime is a brand name of different entities authorised and registered in various jurisdictions.
PU Prime Limited is authorized and regulated by the Financial Services Authority of Seychelles under License No. SD050, with registered address at CT House, Office 1A, Providence, Mahe, Seychelles.
PU Prime Ltd is authorized and regulated by the Financial Services Commission of Mauritius under License No. GB23202672, with registered address at Suite 201 Level 2, The Catalyst Building, 40 Silicon Avenue, Cybercity Ebene, Mauritius.
PU Prime (Pty) Ltd is an authorised Financial Services Provider registered and regulated by the Financial Sector Conduct Authority of South Africa under License No. 52218, with registered address at 37 Harley Street, Ferndale, Randburg, Gauteng, South Africa.
The information on this website is not intended for residents of certain jurisdictions, including the United States, Singapore, Australia, China, Russia, and jurisdictions listed on the FATF and EU/UN sanctions lists. It is not intended for distribution or use where such distribution or use would be contrary to local law or regulation. While the Authority has granted a securities or derivatives investment business licence to the Licensee, it does not endorse the products offered.
Finzero Cap Ltd, registered in the Republic of Cyprus with registration number HE414308 and registered address at 62 Athalassas, Mezzanine, Strovolos 2012, Nicosia, Cyprus, acts as a payment agent to facilitate payment services for PU Prime.
Copyright © 2024 PU Prime.

Please note the Website is intended for individuals residing in jurisdictions where accessing the Website is permitted by law.
Please note that PU Prime and its affiliated entities are neither established nor operating in your home jurisdiction.
By clicking the "Acknowledge" button, you confirm that you are entering this website solely based on your initiative and not as a result of any specific marketing outreach. You wish to obtain information from this website which is provided on reverse solicitation in accordance with the laws of your home jurisdiction.
Thank You for Your Acknowledgement!
Ten en cuenta que el sitio web está destinado a personas que residen en jurisdicciones donde el acceso al sitio web está permitido por la ley.
Ten en cuenta que PU Prime y sus entidades afiliadas no están establecidas ni operan en tu jurisdicción de origen.
Al hacer clic en el botón "Aceptar", confirmas que estás ingresando a este sitio web por tu propia iniciativa y no como resultado de ningún esfuerzo de marketing específico. Deseas obtener información de este sitio web que se proporciona mediante solicitud inversa de acuerdo con las leyes de tu jurisdicción de origen.
Thank You for Your Acknowledgement!
