PU Prime App
Exclusive deals on mobile


PU Prime App
Exclusive deals on mobile
Hold The Global Markets In Your Hands
Our trading mobile app is compatible with most smart devices. Download the App now and start trading with PU Prime on any device, anytime and anywhere.


22 March 2024,05:39
Daily Market AnalysisMarket Insights
22 March 2024, 05:39


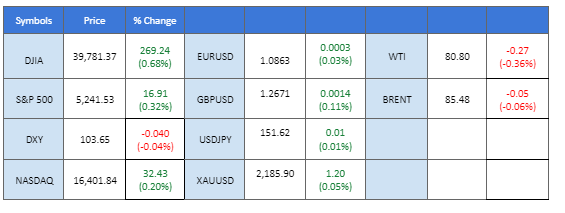
Yesterday witnessed a pronounced rally in the dollar index (DXY), effectively nullifying the losses incurred in the preceding session, with the dollar now vying to surpass its prior resistance level at $104.15. This resurgence was underpinned by encouraging economic indicators, including robust job market data and PMI figures that exceeded market expectations. The consistently strong U.S. economic performance might compel the Federal Reserve to reconsider its rate reduction strategy slated for 2024.
Concurrently, the Bank of England (BoE) adhered to market predictions by maintaining its interest rate stance. Nevertheless, with the UK’s CPI deceleration surpassing anticipations, the central bank has shown a proclivity towards a rate-cutting approach, highlighted by a dovish-pivot from two previously hawkish officials.
This recalibration of expectations towards the Fed’s monetary policy has significantly buoyed the dollar. However, this strength in the dollar exerted considerable pressure on commodity markets, with gold prices retreating nearly 1.50% and oil prices marking three consecutive days of declines, a direct consequence of the dollar’s robust performance.
Current rate hike bets on 1st May Fed interest rate decision:
Source: CME Fedwatch Tool
0 bps (90.0%) VS -25 bps (10%)
(MT4 System Time)
Source: MQL5
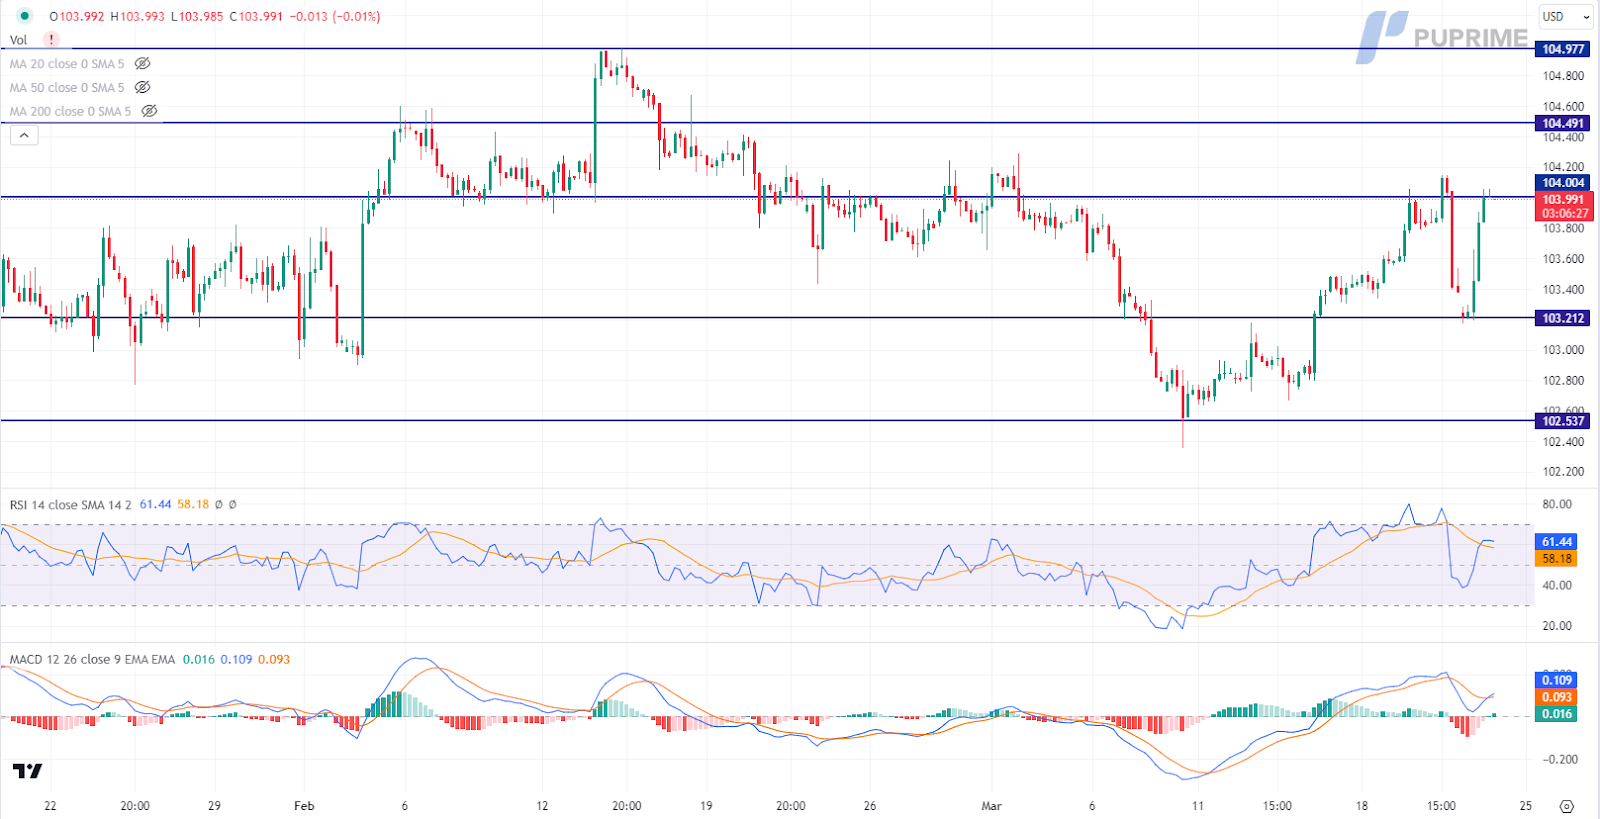
The Dollar Index, tracking the greenback against a basket of major currencies, rallied following the release of better-than-expected US economic data, bolstering confidence in the Federal Reserve’s optimistic outlook. With US Initial Jobless Claims declining to 210,000, surpassing expectations, and Fed Chair Jerome Powell reaffirming the strength of the labor market, investor sentiment favoured the US Dollar. Meanwhile, rising US Treasury bond yields further reinforced the Dollar’s upward momentum, reflecting heightened market confidence in the US economic outlook.
The Dollar Index is trading higher while currently testing the resistance level. MACD has illustrated increasing bullish momentum, while RSI is at 62, suggesting the index might extend its gains after breakout since the RSI stays above the midline.
Resistance level: 104.00, 104.50
Support level:103.20, 102.55
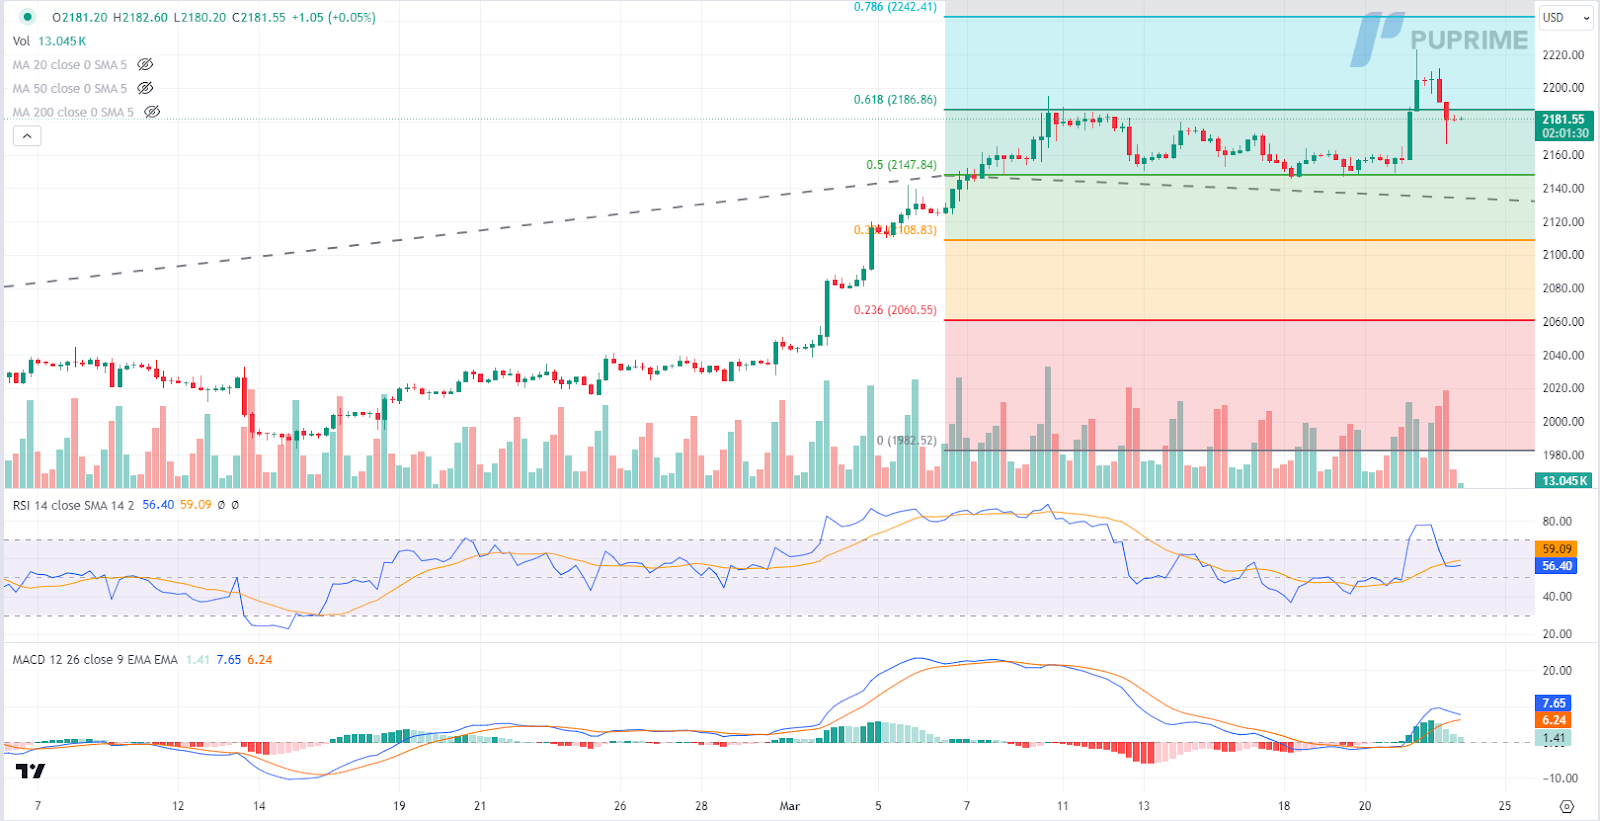
Gold prices dipped from record highs as the US Dollar and US Treasury yields rebounded sharply on the back of positive economic data releases and the Federal Reserve’s optimistic forecast. Despite the Federal Reserve’s upward revisions for the Gross Domestic Product (GDP) and the Core Personal Consumption Expenditure Price Index (PCE) for 2024, which supported the US Dollar, gold’s decline was tempered by ongoing geopolitical tensions and safe-haven demand.
Gold prices are trading lower following the prior retracement from the resistance level. MACD has illustrated diminishing bullish momentum, while RSI is at 56, suggesting the commodity might extend its losses since the RSI retreated sharply from overbought territory.
Resistance level: 2240.00, 2315.00
Support level: 2185.00, 2150.00
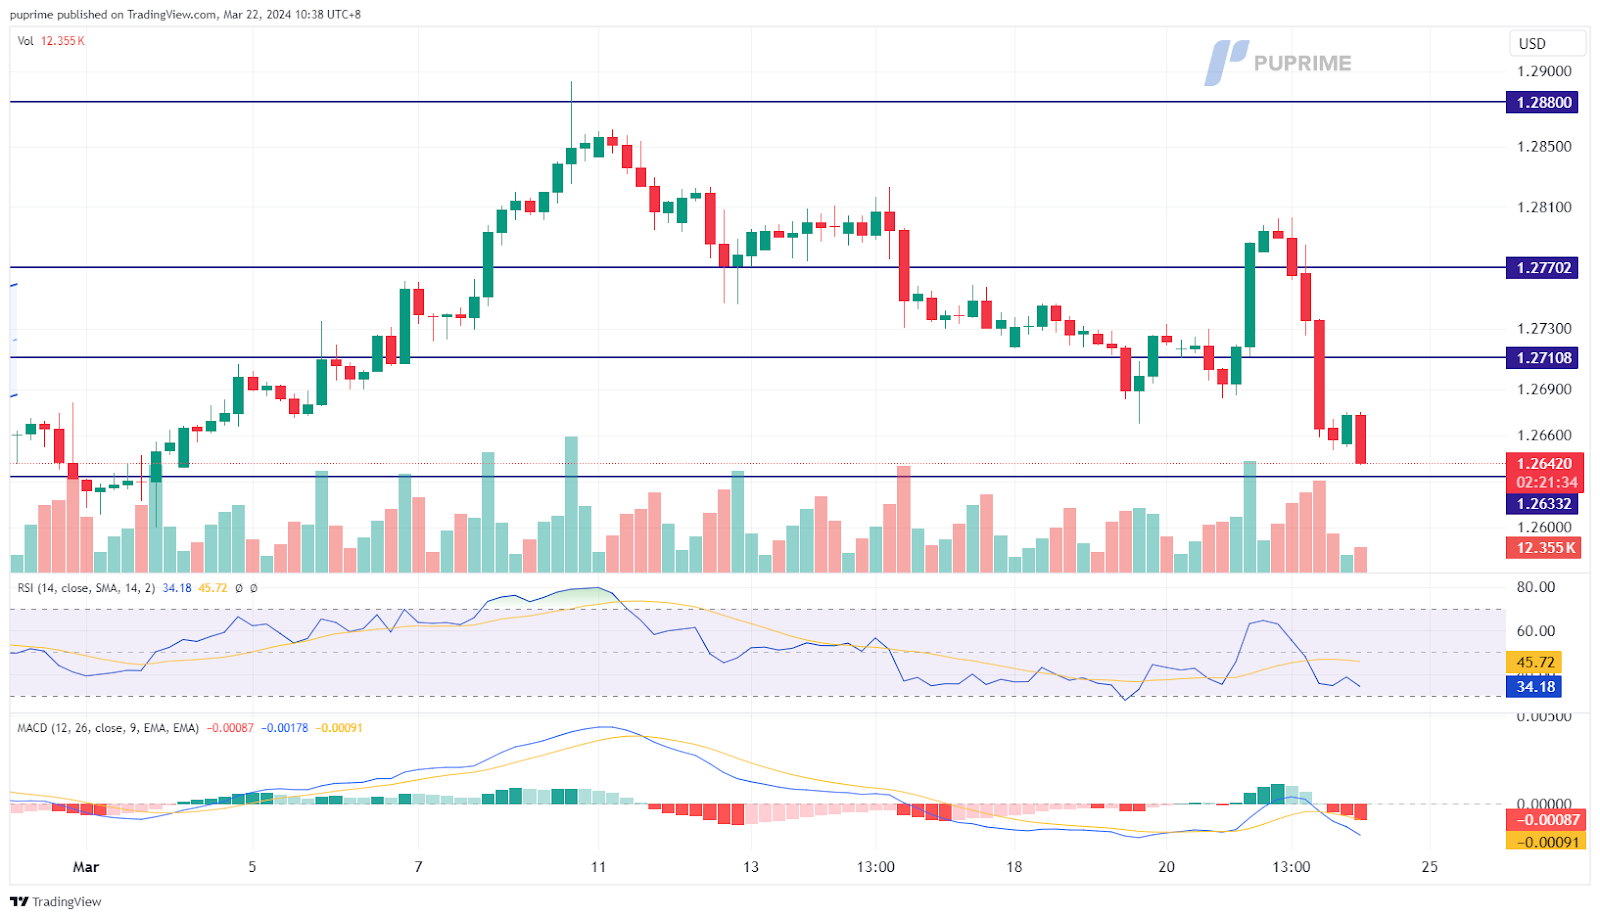
The GBP/USD pair encountered significant headwinds, marking its lowest levels since March. The Bank of England’s (BoE) decision to maintain its interest rates aligned with market forecasts, yet market sentiment leans towards a dovish outlook from the British central bank. This tilt towards a more dovish stance has contributed to the weakening of Sterling. In parallel, the dollar saw a strengthening trend spurred by positive economic data released yesterday. This upward momentum in the dollar added further pressure on the Sterling, compounding the challenges faced by the GBP/USD pair.
GBP/USD hardly hammered yesterday’s session and has reached its lowest levels in March. The RSI is on the brink of breaking into the oversold zone, while the MACD continues to hover below the zero line, suggesting that the bearish momentum is overwhelming.
Resistance level: 1.2770, 1.2700
Support level: 1.2630, 1.2530
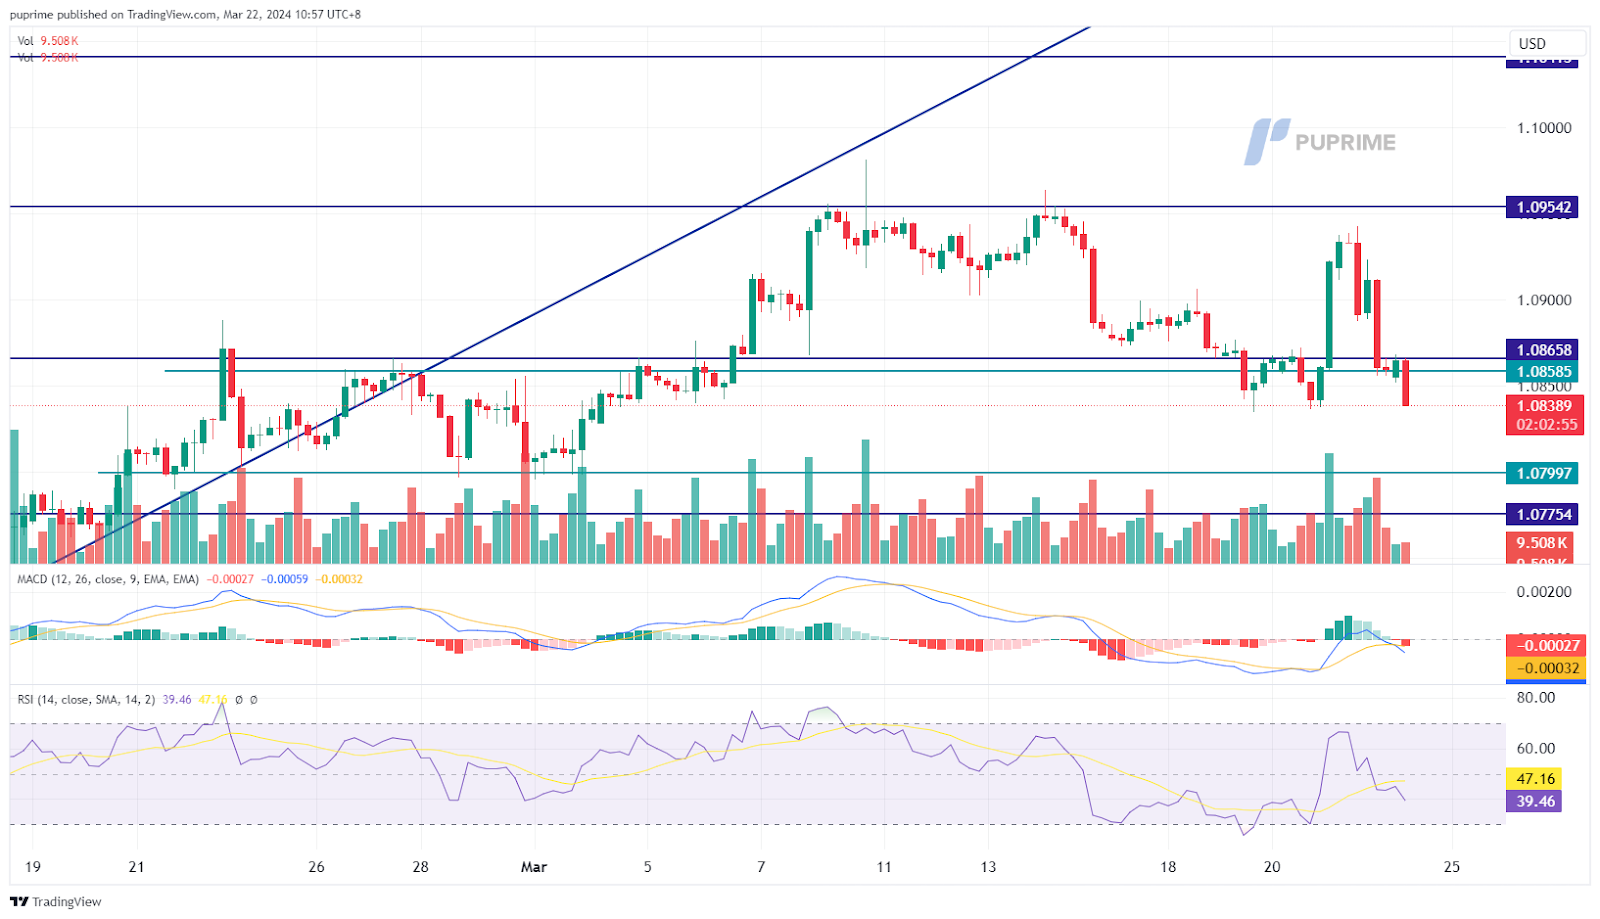
The EUR/USD pair witnessed a significant downturn, nullifying its recent gains. Mixed results from Eurozone and German Purchasing Managers’ Index (PMI) readings hinted at unstable economic performance in the region. Concurrently, the dollar demonstrated strength, buoyed by robust economic data released yesterday. This dollar strength exerted downward pressure on the pair, pushing it towards the brink of breaking below its short-term support level.
EUR/USD has declined sharply and is breaking below its short-term support level. The MACD remains fragile, while the RSI declines sharply from near the overbought zone, suggesting fresh bearish momentum is forming.
Resistance level: 1.0866, 1.0955
Support level: 1.0775, 1.0700
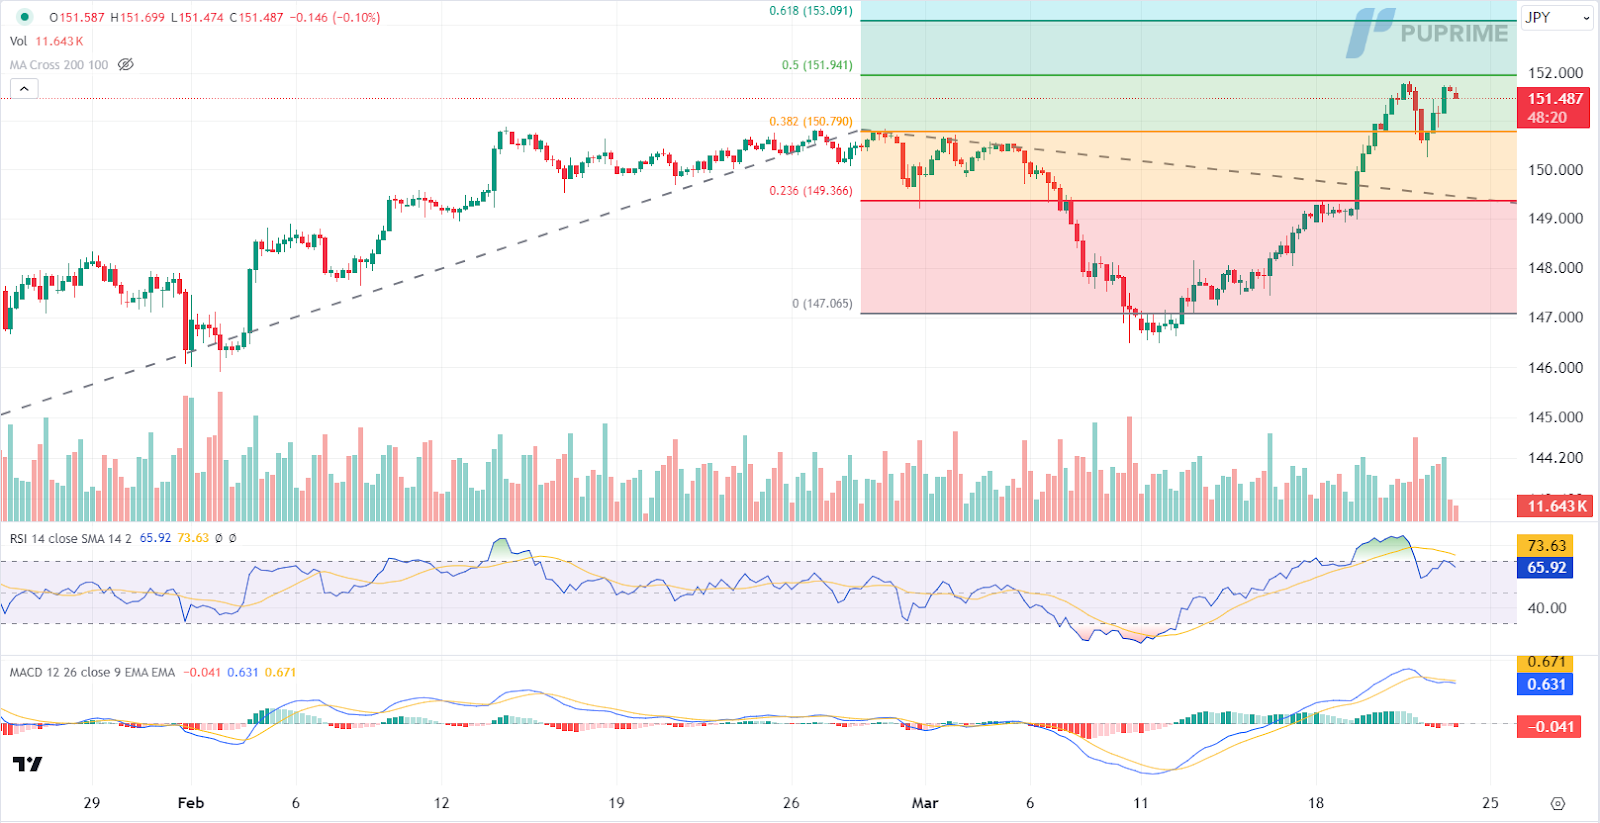
Despite the Bank of Japan’s historic decision to end its negative rate policy with its first hike in 17 years, the Japanese yen remained weak against the backdrop of a widening yield differential between Japan and the US. With the Federal Reserve maintaining its benchmark federal funds rate and better-than-expected US economic data further widening the yield gap, the dollar continued to strengthen against the yen, favouring investments in the US.
USD/JPY is trading higher following the prior rebound from the support level. However, MACD has illustrated increasing bearish momentum, while RSI is at 66, suggesting the pair might experience technical correction since the RSI retreated sharply from overbought territory.
Resistance level: 151.95, 153.10
Support level: 150.80, 149.35
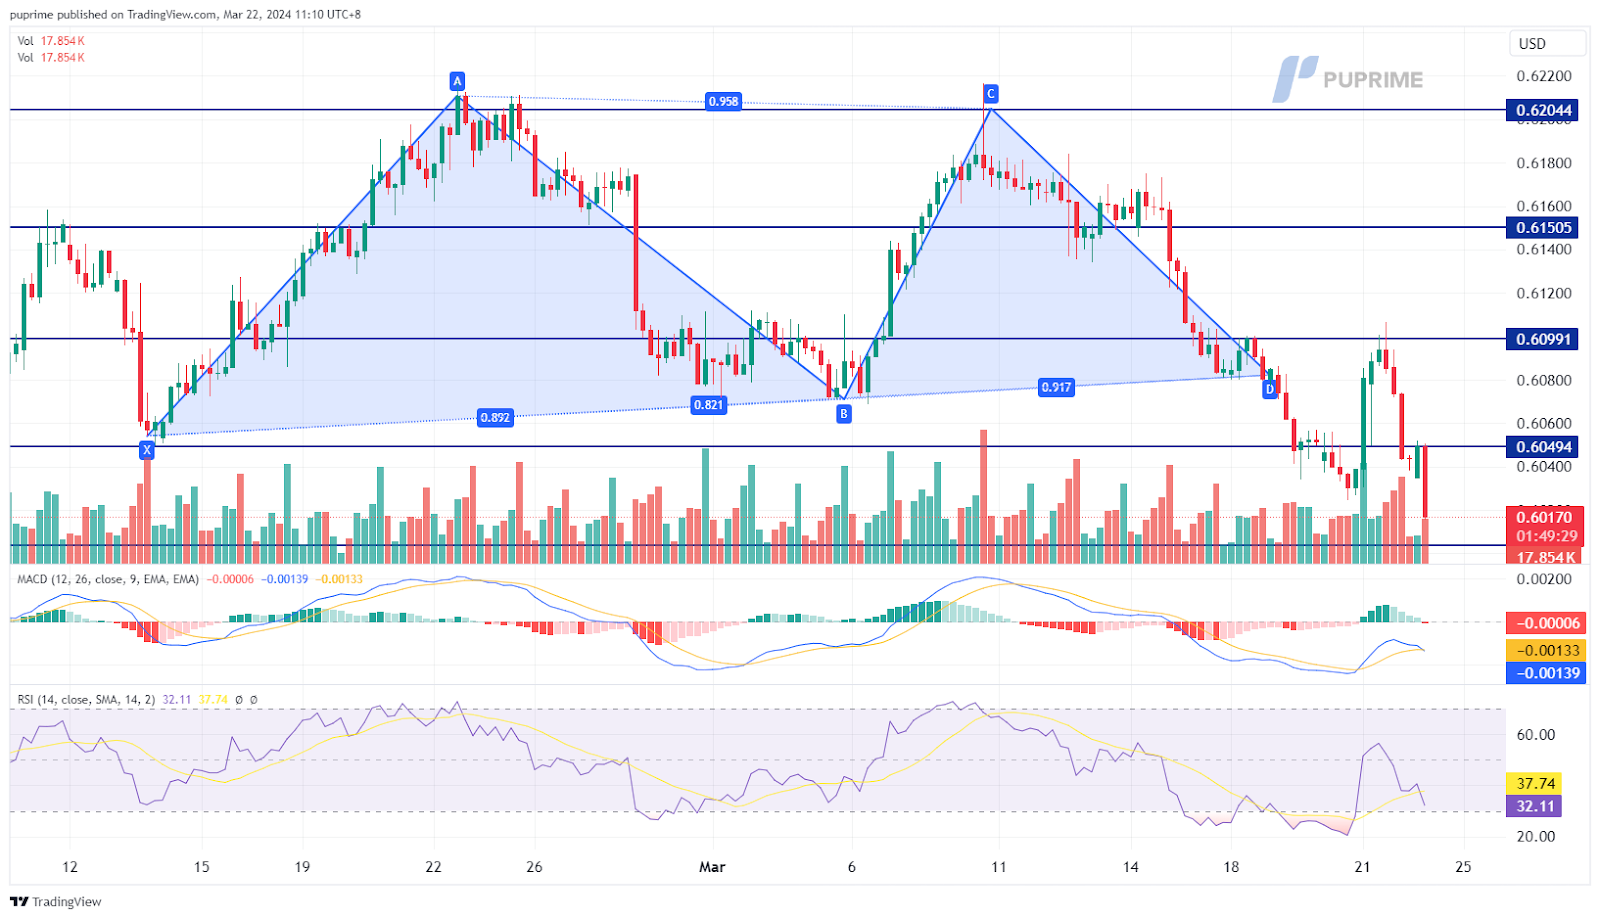
The NZD/USD pair has displayed a double-top pattern, indicating a potential bearish trend. Despite favourable trade balance data released today, the New Zealand dollar has been overshadowed by a strengthened U.S. dollar. With a lack of bullish catalysts for the Kiwi at present, the pair faces challenges in reversing its trend.
The NZD/USD pair has formed a double-top pattern, suggesting a potential fresh bearish trend. The MACD continues to flow below the zero line while the RSI has declined from near the 50 level, suggesting the pair remain trading with bearish momentum.
Resistance level:0.6050, 0.6100
Support level: 0.6005, 0.5950
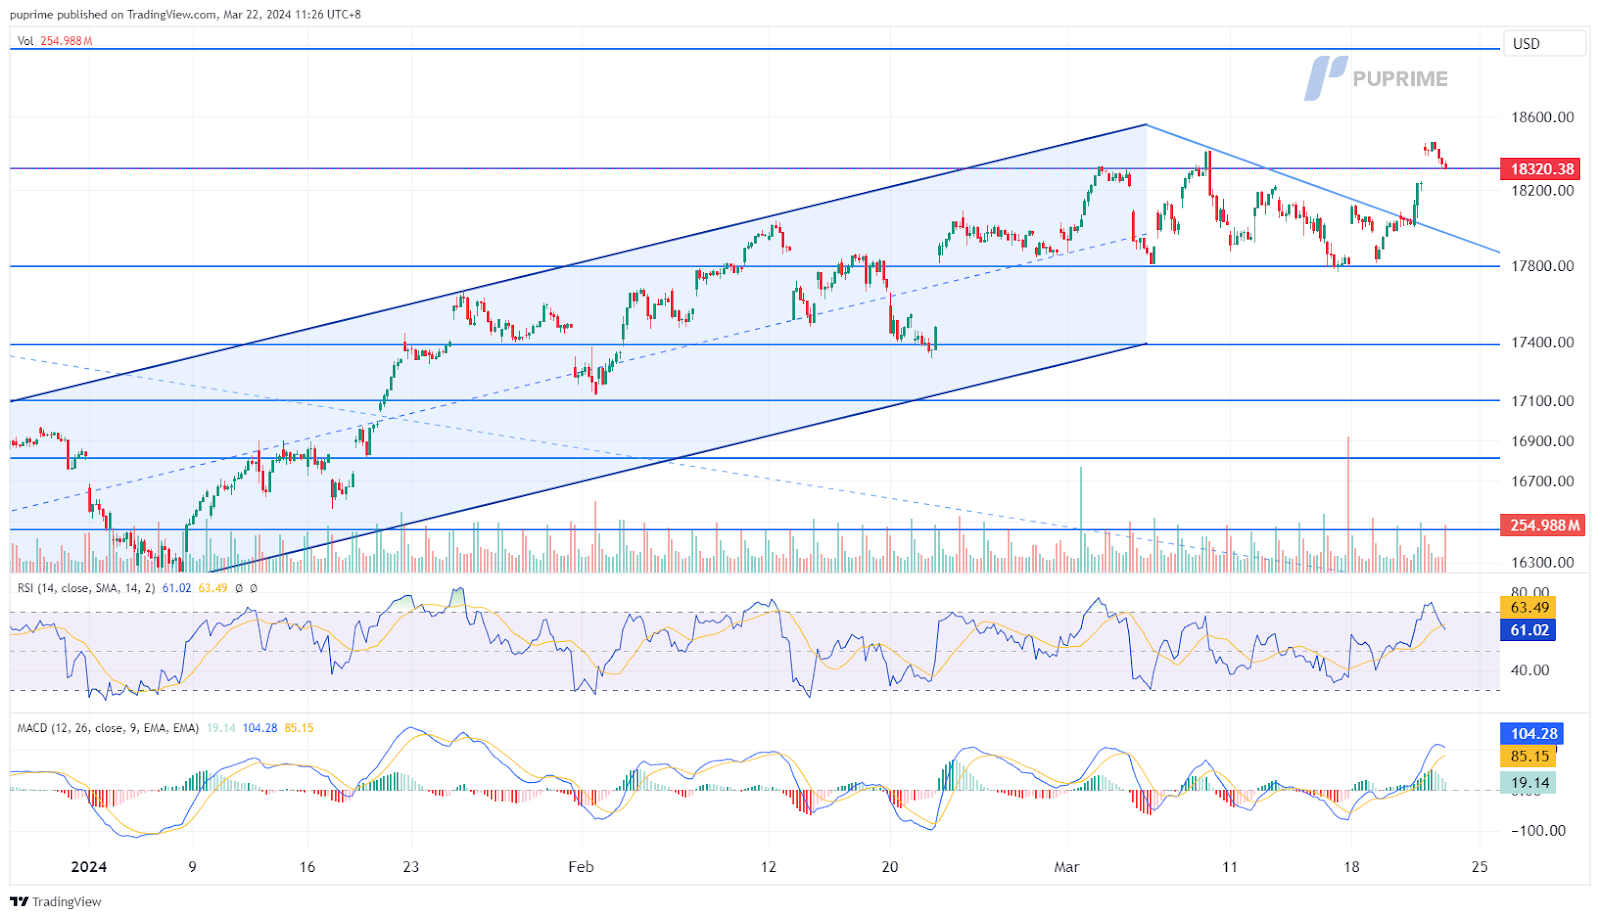
The Nasdaq index continued its upward trajectory, surpassing its all-time high, and maintained bullish momentum. Despite U.S. economic indicators consistently outperforming expectations, a shift in market sentiment has influenced the equity markets, with the Nasdaq managing to close above its previous session. The impressive performance of Reddit contributed to the U.S. equity market’s strength, which had its initial public offering (IPO) yesterday, further fueling optimism among investors.
Nasdaq has broken another all-time high level, suggesting the long-term uptrend bias remains with the index. The RSI has once again broken into the overbought zone while the MACD continues to edge higher, suggesting the bullish momentum remains strong.
Resistance level: 18970.00, 19320.00
Support level:17800.00, 17390.00
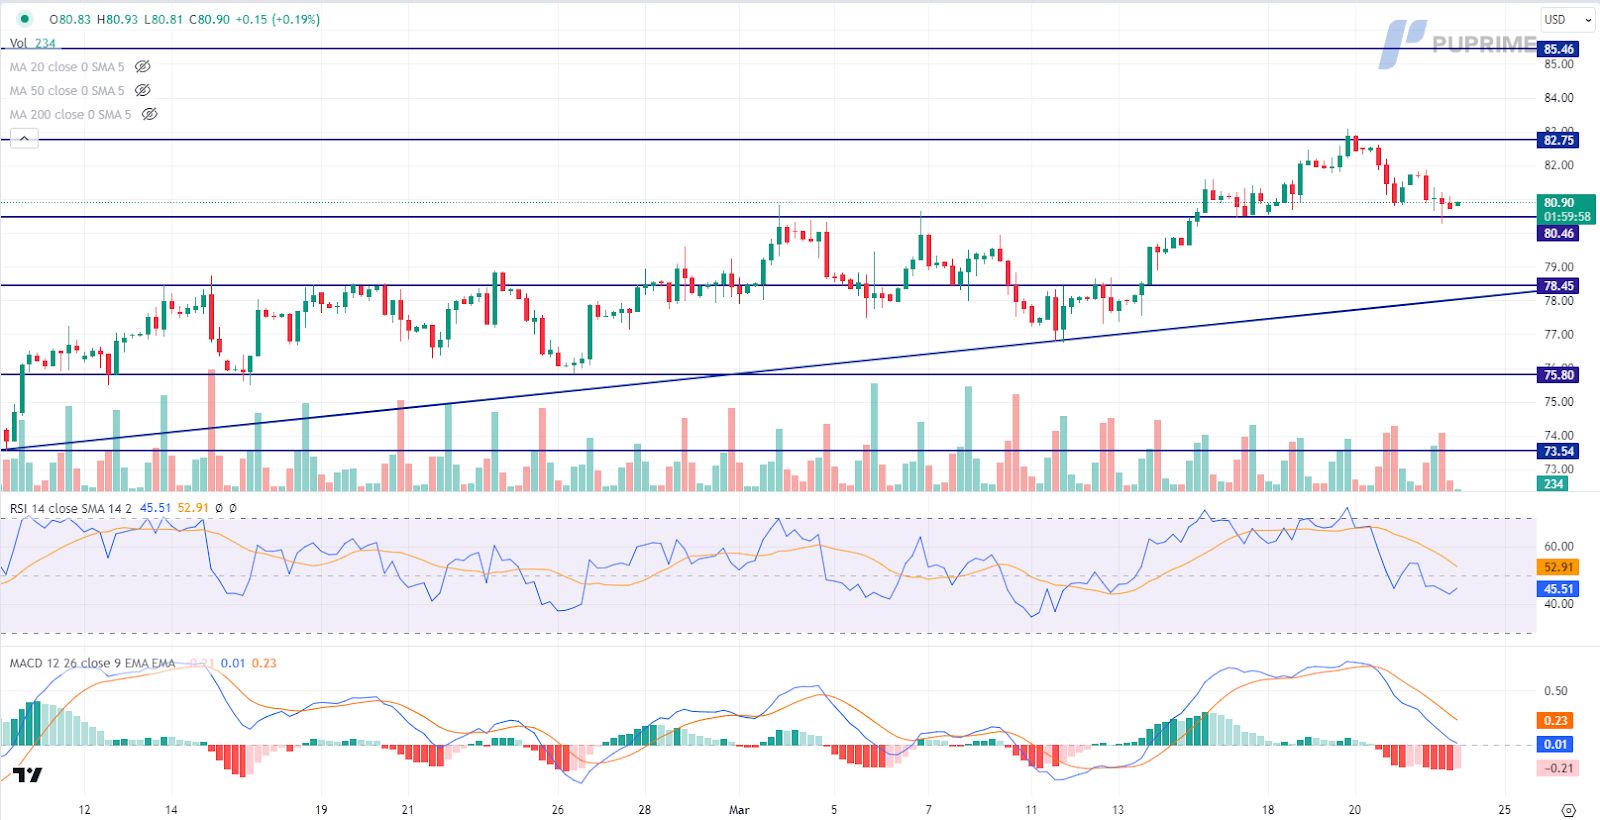
Crude oil prices faced downward pressure amid weaker US gasoline demand data and reports of a United Nations draft resolution calling for a ceasefire in Gaza, easing concerns of supply disruptions. Despite an unexpected decline in US crude inventories reported by the Energy Information Administration (EIA), gasoline product demand slipped below 9 million barrels, contributing to the overall bearish sentiment in the oil market. Geopolitical tensions also weighed on oil prices, with the US drafting a UN resolution aimed at facilitating a ceasefire, dampening market fears.
Oil prices are trading lower while currently testing the support level. MACD has illustrated increasing bearish momentum, while RSI is at 45, suggesting the commodity might extend its losses after breakout since the RSI stays below the midline.
Resistance level: 82.75, 85.45
Support level: 80.45, 78.45

Trade forex, indices, metal, and more at industry-low spreads and lightning-fast execution.
Sign up for a PU Prime Live Account with our hassle-free process.
Effortlessly fund your account with a wide range of channels and accepted currencies.
Access hundreds of instruments under market-leading trading conditions.
Trading Platforms
Education
Company
FAQs
PU Prime App - Start Trading with an Edge


Risk Warning: Trading Contract for Difference (CFD) carries a high level of risk to your capital and may result in losses that exceed your deposits due to leverage. It's important to understand how CFDs work and assess whether you can afford the high risk of losing your money. When acquiring our derivative products, you do not own or have rights in the underlying assets. Past performance is not indicative of future results. The information on this website is general and does not take into account your personal objectives, financial circumstances, or needs. Seek independent advice from qualified experts if necessary, and ensure you fully understand the risks before making any trading decisions.
PU Prime is a brand name of different entities authorised and registered in various jurisdictions.
PU Prime Limited is authorized and regulated by the Financial Services Authority of Seychelles under License No. SD050, with registered address at CT House, Office 1A, Providence, Mahe, Seychelles.
PU Prime Ltd is authorized and regulated by the Financial Services Commission of Mauritius under License No. GB23202672, with registered address at Suite 201 Level 2, The Catalyst Building, 40 Silicon Avenue, Cybercity Ebene, Mauritius.
PU Prime (Pty) Ltd is an authorised Financial Services Provider registered and regulated by the Financial Sector Conduct Authority of South Africa under License No. 52218, with registered address at 37 Harley Street, Ferndale, Randburg, Gauteng, South Africa.
The information on this website is not intended for residents of certain jurisdictions, including the United States, Singapore, Australia, China, Russia, and jurisdictions listed on the FATF and EU/UN sanctions lists. It is not intended for distribution or use where such distribution or use would be contrary to local law or regulation. While the Authority has granted a securities or derivatives investment business licence to the Licensee, it does not endorse the products offered.
Finzero Cap Ltd, registered in the Republic of Cyprus with registration number HE414308 and registered address at 62 Athalassas, Mezzanine, Strovolos 2012, Nicosia, Cyprus, acts as a payment agent to facilitate payment services for PU Prime.
Copyright © 2024 PU Prime.

Please note the Website is intended for individuals residing in jurisdictions where accessing the Website is permitted by law.
Please note that PU Prime and its affiliated entities are neither established nor operating in your home jurisdiction.
By clicking the "Acknowledge" button, you confirm that you are entering this website solely based on your initiative and not as a result of any specific marketing outreach. You wish to obtain information from this website which is provided on reverse solicitation in accordance with the laws of your home jurisdiction.
Thank You for Your Acknowledgement!
Ten en cuenta que el sitio web está destinado a personas que residen en jurisdicciones donde el acceso al sitio web está permitido por la ley.
Ten en cuenta que PU Prime y sus entidades afiliadas no están establecidas ni operan en tu jurisdicción de origen.
Al hacer clic en el botón "Aceptar", confirmas que estás ingresando a este sitio web por tu propia iniciativa y no como resultado de ningún esfuerzo de marketing específico. Deseas obtener información de este sitio web que se proporciona mediante solicitud inversa de acuerdo con las leyes de tu jurisdicción de origen.
Thank You for Your Acknowledgement!
