PU Prime App
Exclusive deals on mobile


PU Prime App
Exclusive deals on mobile
Hold The Global Markets In Your Hands
Our trading mobile app is compatible with most smart devices. Download the App now and start trading with PU Prime on any device, anytime and anywhere.


27 March 2024,05:50
Daily Market AnalysisMarket Insights
27 March 2024, 05:50

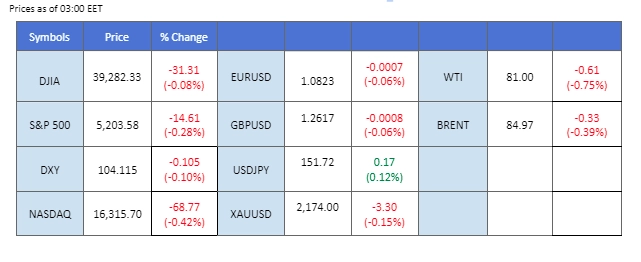
The dollar index (DXY) saw an uptick yesterday amid favourable economic indicators, reinforcing the perception of a robust U.S. economy. Notably, the growth in Durable Goods Orders from -6.9% to 1.4% for February indicates ongoing consumption growth, potentially fueling persistent inflationary pressures. This development has caused a recalibration of market expectations regarding the Federal Reserve’s potential rate cuts, leading to a downturn in the U.S. equity market as investors await the PCE index data due on Friday.
Amidst the dollar’s strengthening, the Japanese Yen has remained weak, approaching levels that may prompt intervention by Japanese authorities to stabilise the currency.
In commodities, the cocoa futures contract experienced a significant surge, reaching an all-time high of over $10,000 in the last session. The global cocoa market is currently grappling with its largest supply deficit in over six decades. Analysts warn that the situation may deteriorate further, suggesting a continued bullish trend for cocoa prices as the market adjusts to these unprecedented supply challenges.
Current rate hike bets on 1st May Fed interest rate decision:
Source: CME Fedwatch Tool
0 bps (85.5%) VS -25 bps (14.5%)
(MT4 System Time)
Source: MQL5
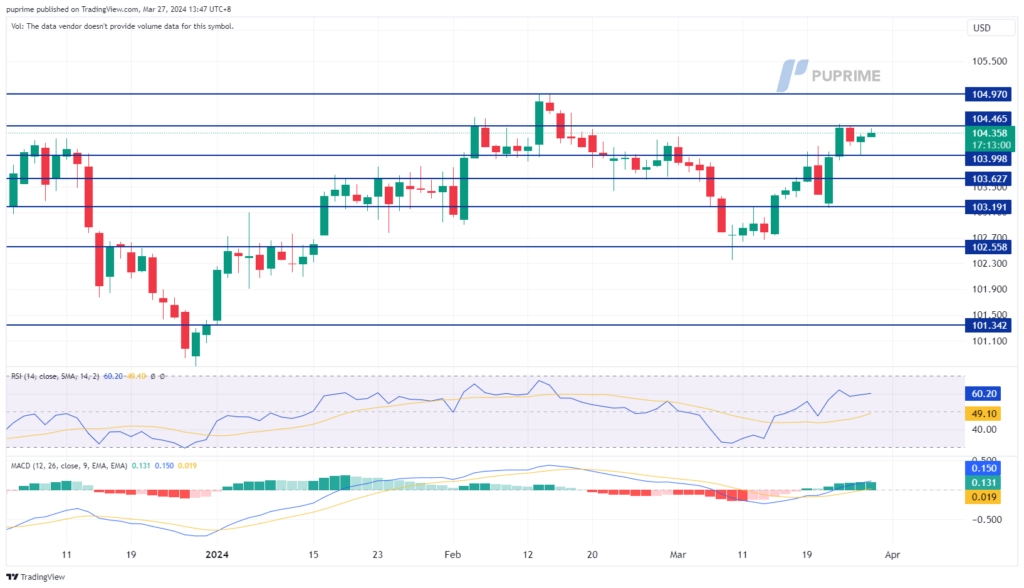
The Dollar Index, tracking against a basket of major currencies, held firm amidst a wait-and-see sentiment among investors. With anticipation mounting for the release of the PCE Price Index data, crucial for gauging inflation and scheduled for Good Friday, market movement is expected to remain subdued. Despite the holiday, Top Fed officials, including Chair Jerome Powell and Mary Daly, are slated to provide insights, setting the stage for potential market shifts. Traders are advised to stay vigilant and strategize as economic data released over the weekend could spur heightened volatility come Monday.
The Dollar Index is trading higher while currently testing the resistance level. MACD has illustrated diminishing bearish momentum, while RSI is at 63, suggesting the index might extend its gains after breakout since the RSI stays above the midline.
Resistance level: 104.45, 104.95
Support level:104.00, 103.65
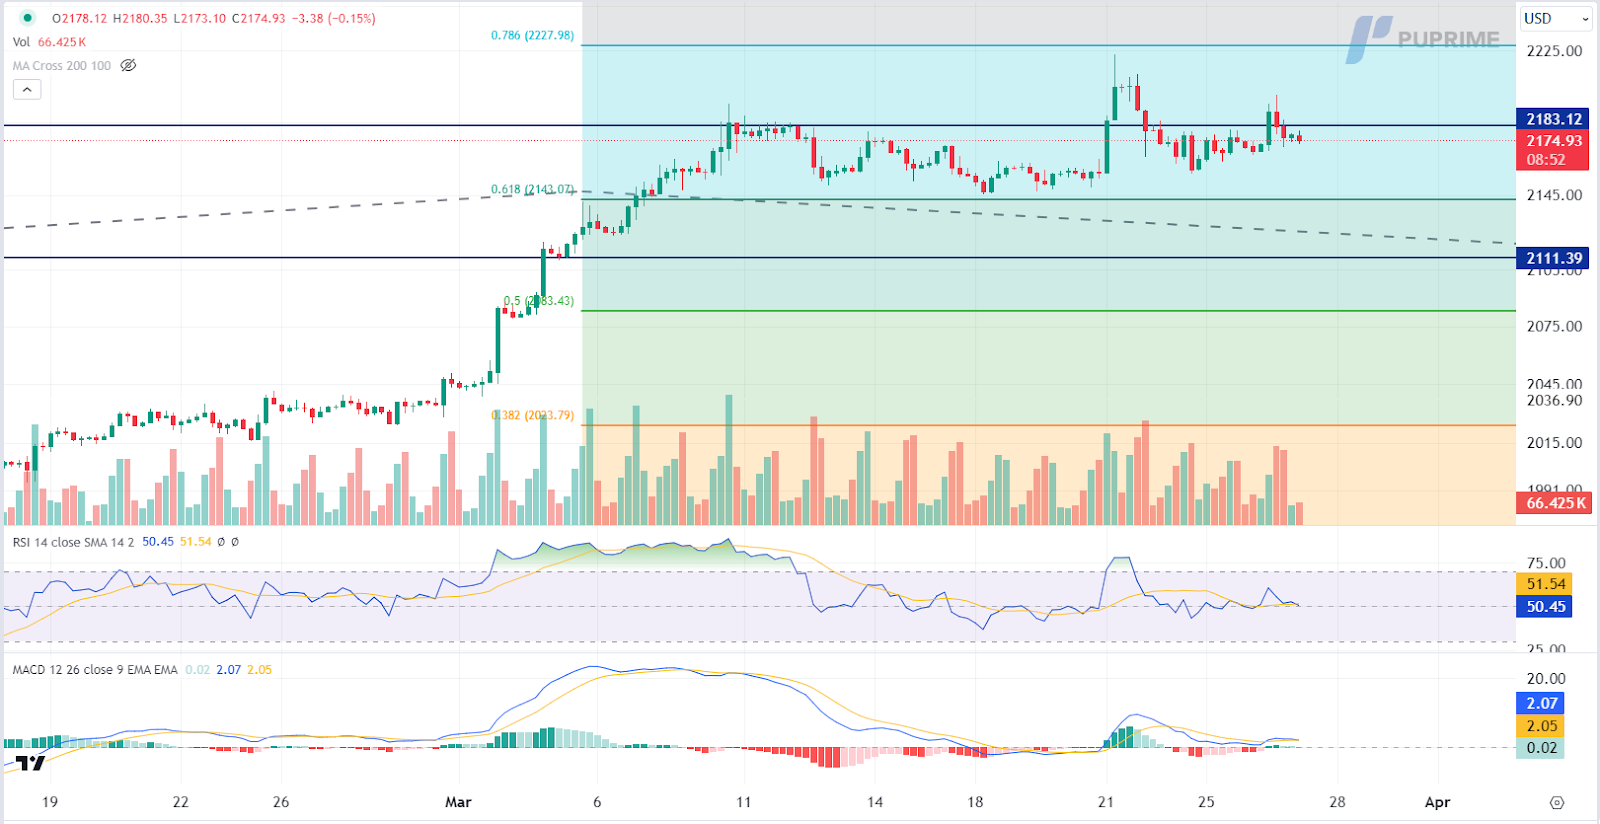
Gold prices saw a modest rebound, finding support near key resistance levels amid lacklustre economic data from the US. The Conference Board’s consumer confidence index fell below expectations, signalling persistent concerns about economic activity. As volatility looms with major events and data releases on the horizon, gold’s safe-haven appeal is expected to remain robust, potentially buoying prices in the coming days.
Gold prices are trading higher while currently testing the resistance level. However, MACD has illustrated diminishing bullish momentum, while RSI is at 50, suggesting the commodity might experience technical correction since the RSI retreated sharply from overbought territory.
Resistance level: 2185.00, 2230.00
Support level: 2145.00, 2110.00
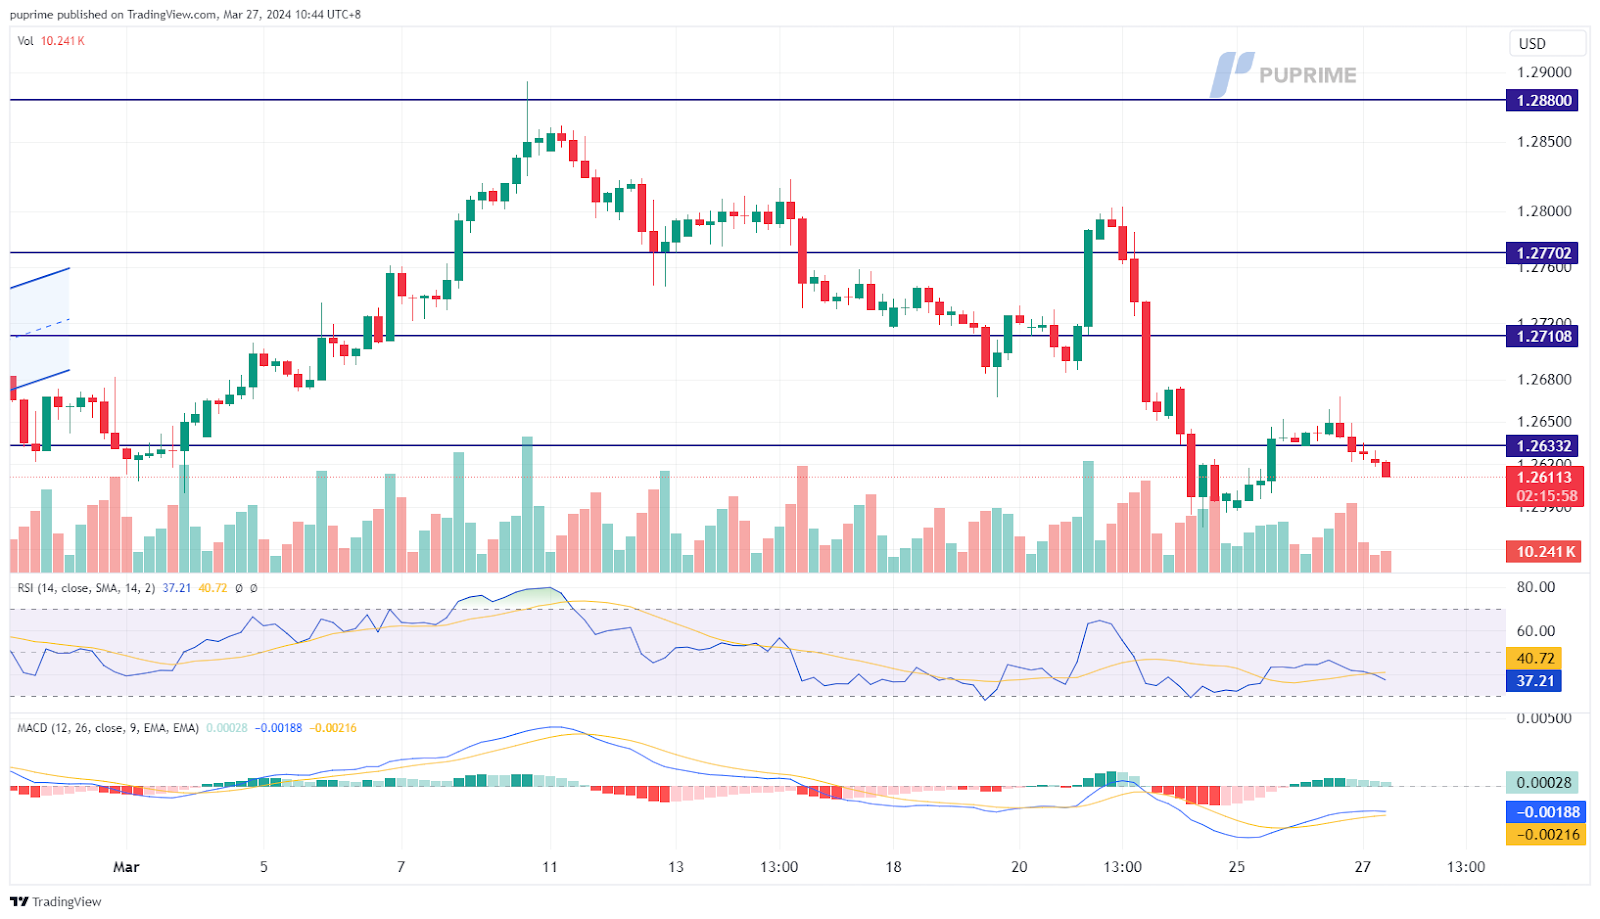
The GBP/USD pair maintained its bearish trajectory following a brief technical rebound earlier in the week. This decline was primarily attributed to positive U.S. economic data, particularly the increase in Durable Goods Orders from -6.9% to 1.4% in February. However, the downward movement was somewhat tempered by a hawkish stance from the Bank of England’s Mann, who indicated a more optimistic view on the UK’s wage growth compared to the U.S. and EU.
GBP/USD continues to trade lower after a technical rebound. The RSI hovers in the lower region, while the MACD flows below the zero line, suggesting that the bearish momentum is overwhelming.
Resistance level: 1.2710, 1.2770
Support level: 1.2530, 1.2440
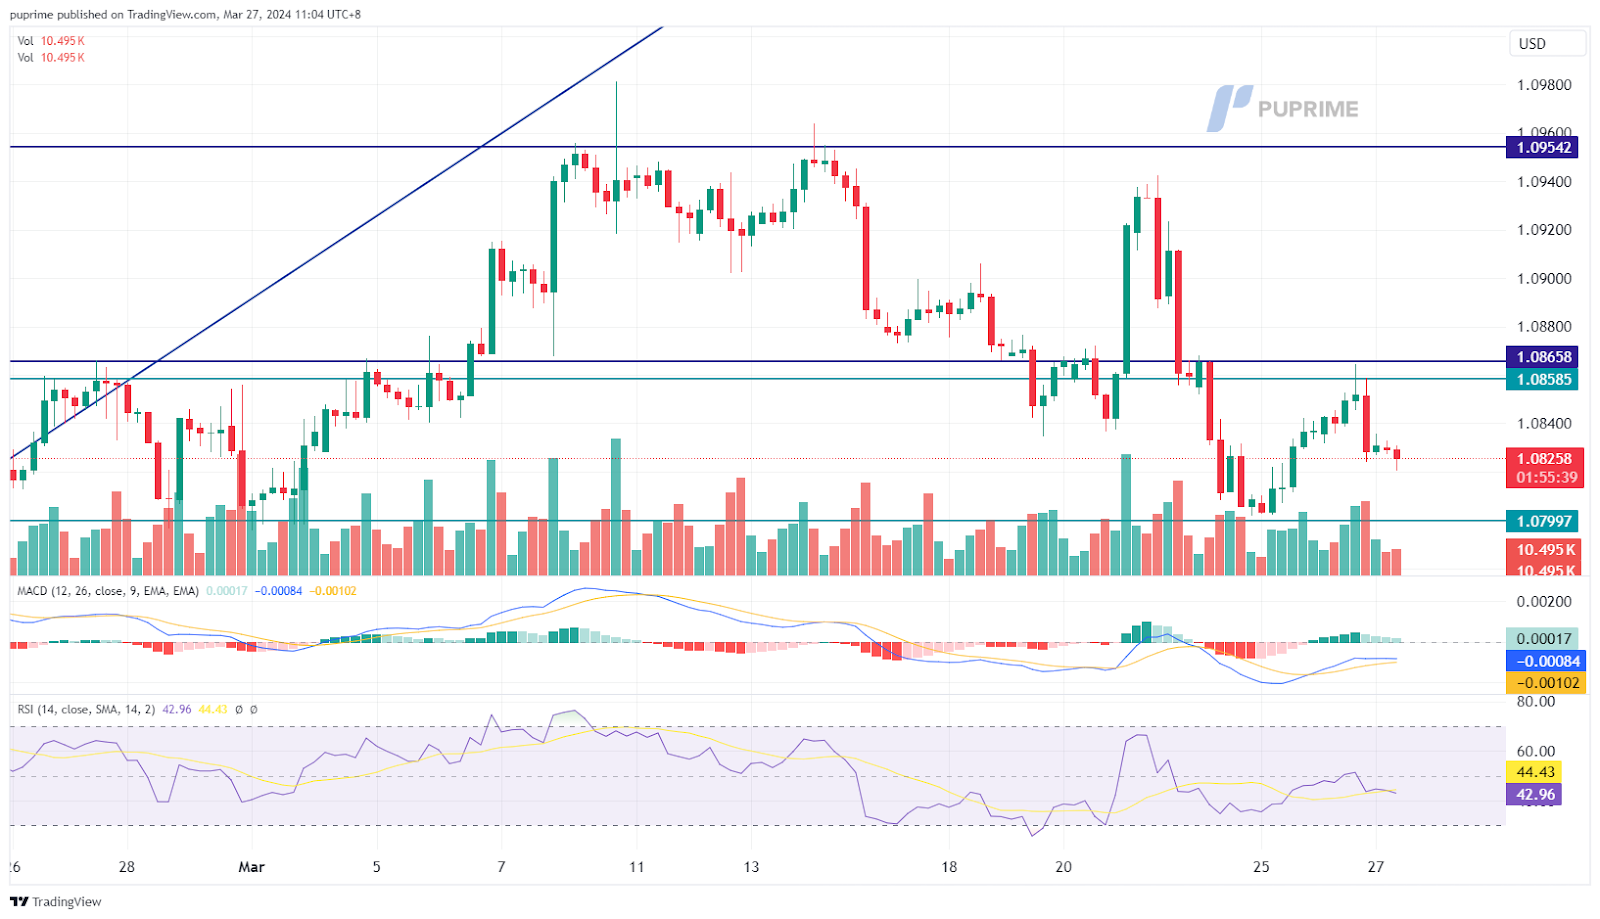
The EUR/USD pair experienced a modest retracement after bouncing back from its recent low around 1.0800. This retracement was driven by a strengthening of the dollar yesterday, supported by upbeat U.S. economic data. In contrast, the euro lacked significant catalysts for further gains. Moreover, with the euro’s Consumer Price Index (CPI) being lower than that of the U.S. and UK, market expectations of a potential rate cut by the European Central Bank (ECB) have been growing, adding downward pressure on the euro.
EUR/USD retraced from its technical rebound, suggesting the pair remain trading with its long-term bearish trajectory. The MACD remains flowing below the zero line while the RSI, hovering at below 50 levels, suggests the pair remain trading with bearish momentum.
Resistance level: 1.0866, 1.0955
Support level: 1.0780, 1.0700
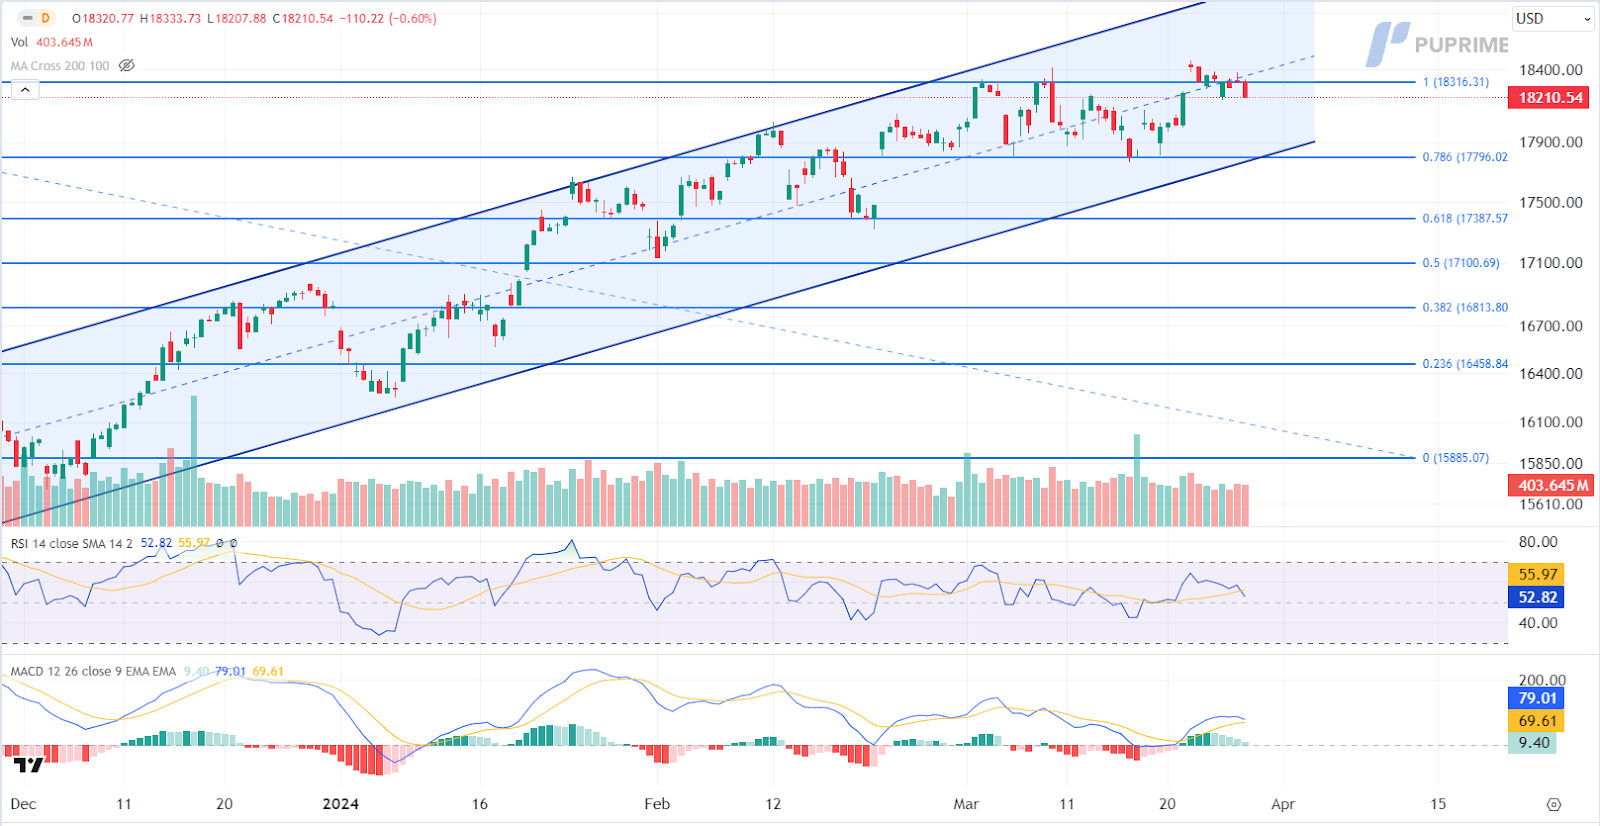
The US equity market experienced a decline, relinquishing earlier gains and marking the third consecutive downturn for Nasdaq. With investors awaiting economic data in a truncated holiday week to gauge the Federal Reserve’s policy direction, market sentiment remained subdued. Expectations for a flat trend in equities persist as traders seek clarity amidst ongoing uncertainties.
Nasdaq is trading lower following the prior retracement from the resistance level. MACD has illustrated diminishing bullish momentum, while RSI is at 53, suggesting the index might extend its losses since the RSI retreated sharply from overbought territory.
Resistance level: 18315.00, 18975.00
Support level: 17795.00, 17385.00
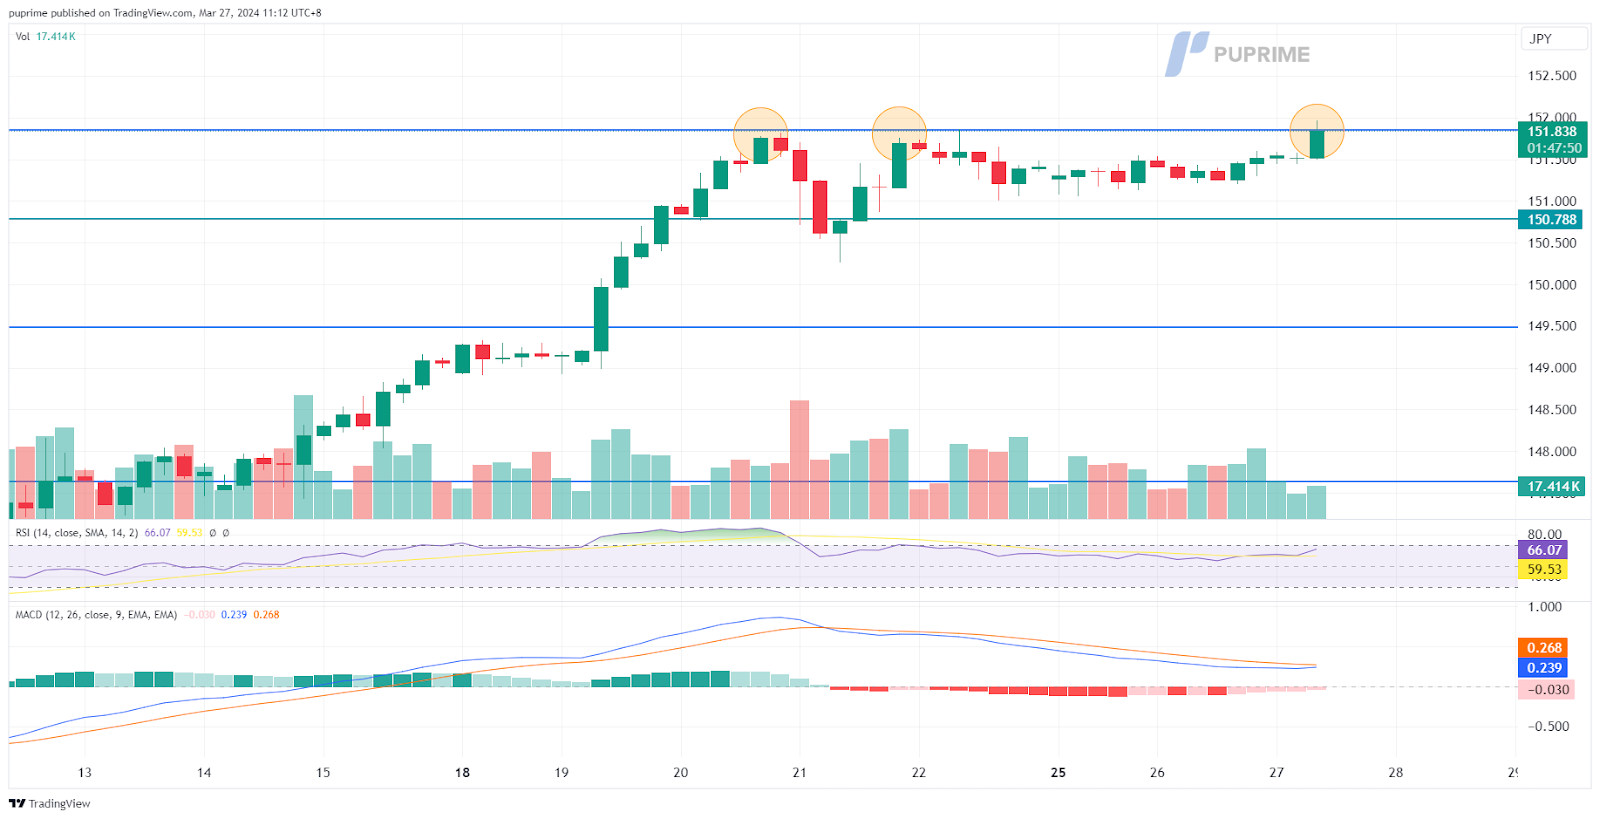
The USD/JPY pair touched its weakest level against the U.S. dollar for the third time, nearing the 152.00 level, following Japan’s first rate hike since 2007. The Japanese Yen has approached intervention levels last seen in 2022, prompting speculation of potential currency intervention by Japanese authorities. The Japanese Finance Minister indicated openness to considering measures to address the weakening yen, further contributing to market speculation regarding potential intervention.
The USD/JPY pair has formed a triple-top price pattern, if a break from current level suggests a solid bullish signal; a drop from current level would suggest a bearish signal. However, there is a divergence as the pair continue to surge, but the MACD continues to edge lower while the RSI hovers near the overbought zone.
Resistance level: 151.85, 153.35
Support level: 149.50, 147.65
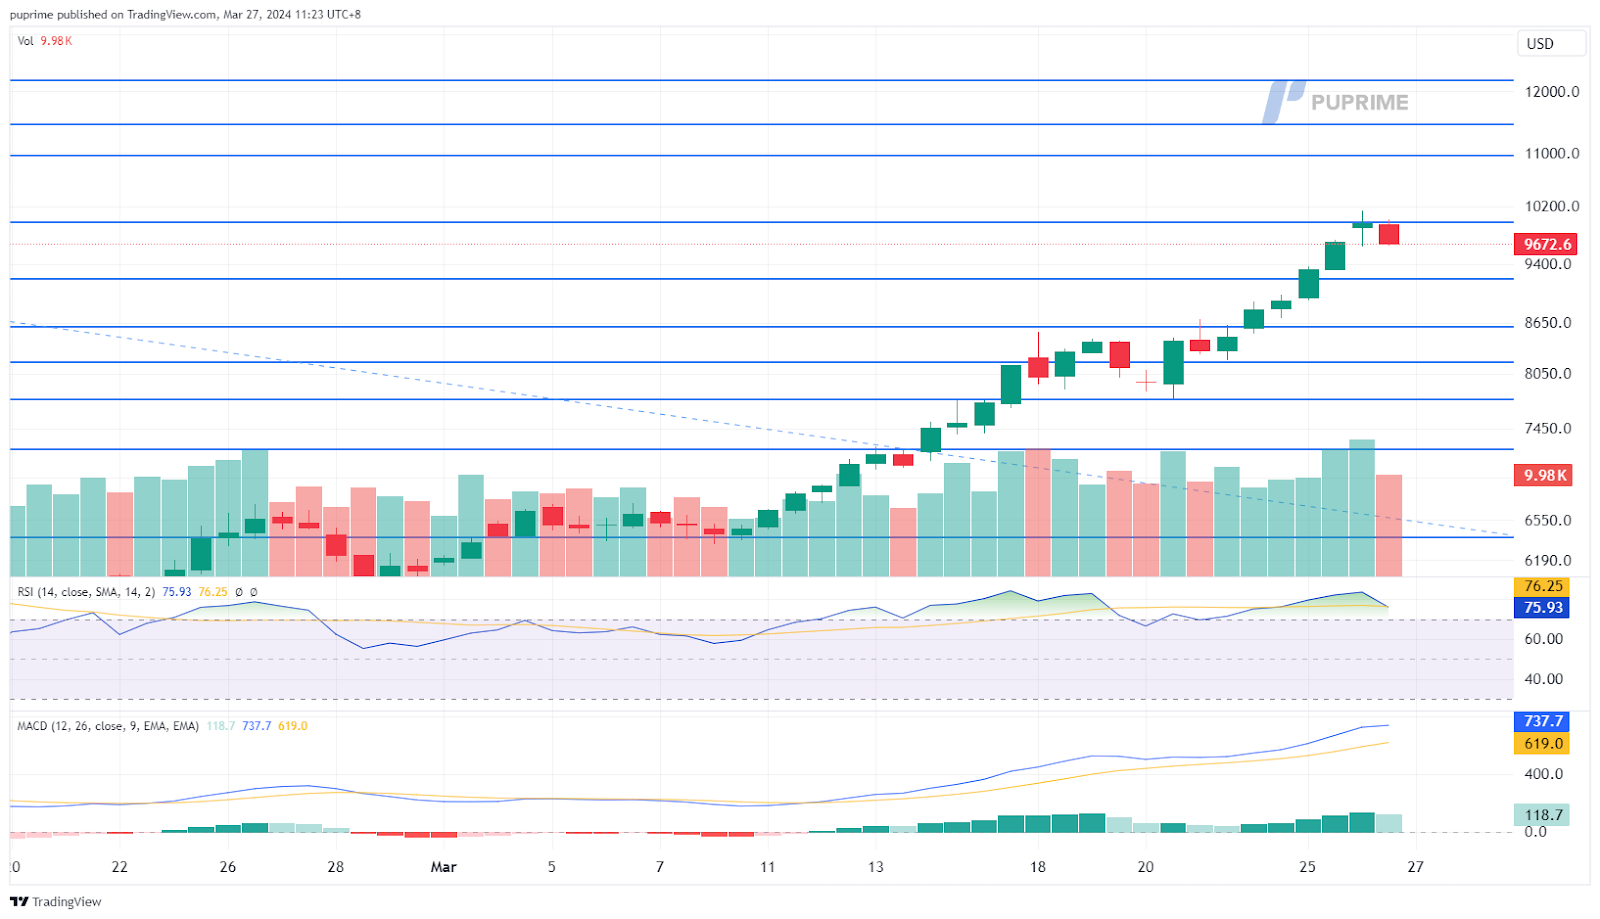
The surge in cocoa futures to an all-time high, trading above the $10,000 mark, marks a significant event in the commodity markets, largely attributed to the worst global cocoa shortage in 60 years. This bull run, which began in 2023 and has seen gains of over 140% in 2024, underscores the severe supply constraints impacting the cocoa market. The critical shortage is propelling the prices upward, and strategists are warning that the situation could worsen, suggesting the potential for continued climbs in cocoa futures.
Cocoa futures prices continue to trade with its extreme bullish momentum. The RSI has been hovering in the overbought zone for most of the time in 2024 while the MACD continues to surge, suggesting the bullish momentum remains strong.
Resistance level: 10950.00, 11460.00
Support level: 9210.00, 8600.00
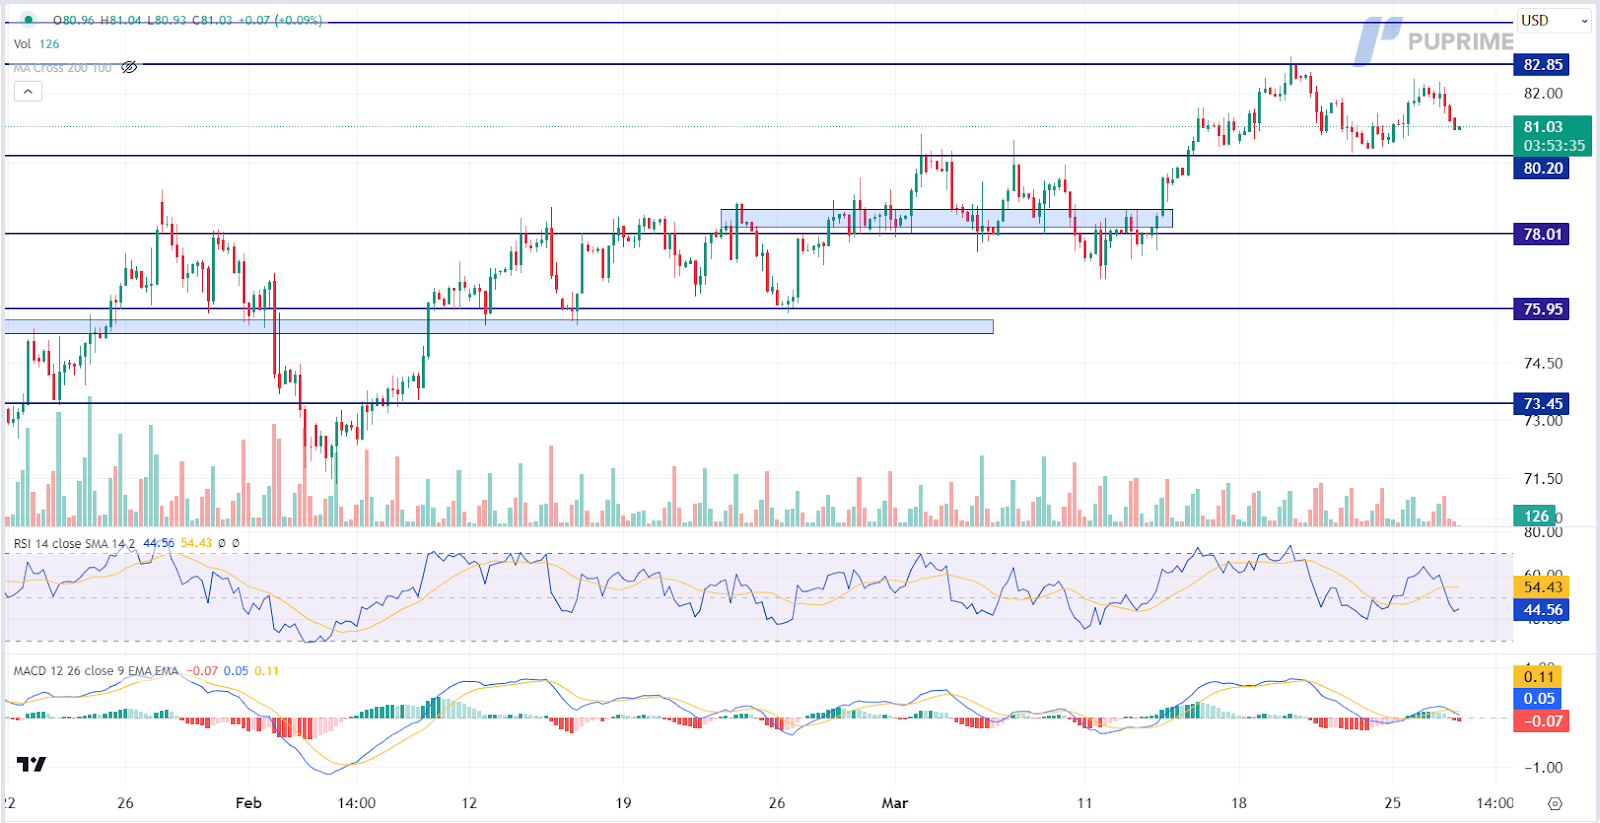
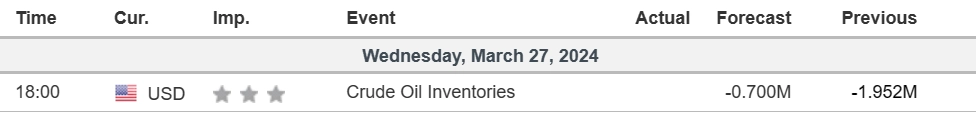
Crude oil prices retreated from significant resistance levels as market sentiment remained tepid ahead of key events. Investors opted to shed high-risk commodities amidst lingering uncertainties. However, losses were tempered by concerns over potential supply disruptions, notably after Russia’s directive to companies to curtail output in line with OPEC+ commitments. With US crude inventories registering a significant uptick, attention shifts to the upcoming EIA Oil inventories release and broader economic performance for crucial trading cues.
Oil prices are trading lower following the prior retracement from the resistance level. MACD has illustrated increasing bearish momentum, while RSI is at 43, suggesting the commodity might extend its losses toward support level since the RSI stays below the midline.
Resistance level: 82.85, 84.10
Support level: 80.20, 78.00

Trade forex, indices, metal, and more at industry-low spreads and lightning-fast execution.
Sign up for a PU Prime Live Account with our hassle-free process.
Effortlessly fund your account with a wide range of channels and accepted currencies.
Access hundreds of instruments under market-leading trading conditions.
Trading Platforms
Education
Company
FAQs
PU Prime App - Start Trading with an Edge


Risk Warning: Trading Contract for Difference (CFD) carries a high level of risk to your capital and may result in losses that exceed your deposits due to leverage. It's important to understand how CFDs work and assess whether you can afford the high risk of losing your money. When acquiring our derivative products, you do not own or have rights in the underlying assets. Past performance is not indicative of future results. The information on this website is general and does not take into account your personal objectives, financial circumstances, or needs. Seek independent advice from qualified experts if necessary, and ensure you fully understand the risks before making any trading decisions.
PU Prime is a brand name of different entities authorised and registered in various jurisdictions.
PU Prime Limited is authorized and regulated by the Financial Services Authority of Seychelles under License No. SD050, with registered address at CT House, Office 1A, Providence, Mahe, Seychelles.
PU Prime Ltd is authorized and regulated by the Financial Services Commission of Mauritius under License No. GB23202672, with registered address at Suite 201 Level 2, The Catalyst Building, 40 Silicon Avenue, Cybercity Ebene, Mauritius.
PU Prime (Pty) Ltd is an authorised Financial Services Provider registered and regulated by the Financial Sector Conduct Authority of South Africa under License No. 52218, with registered address at 37 Harley Street, Ferndale, Randburg, Gauteng, South Africa.
The information on this website is not intended for residents of certain jurisdictions, including the United States, Singapore, Australia, China, Russia, and jurisdictions listed on the FATF and EU/UN sanctions lists. It is not intended for distribution or use where such distribution or use would be contrary to local law or regulation. While the Authority has granted a securities or derivatives investment business licence to the Licensee, it does not endorse the products offered.
Finzero Cap Ltd, registered in the Republic of Cyprus with registration number HE414308 and registered address at 62 Athalassas, Mezzanine, Strovolos 2012, Nicosia, Cyprus, acts as a payment agent to facilitate payment services for PU Prime.
Copyright © 2024 PU Prime.

Please note the Website is intended for individuals residing in jurisdictions where accessing the Website is permitted by law.
Please note that PU Prime and its affiliated entities are neither established nor operating in your home jurisdiction.
By clicking the "Acknowledge" button, you confirm that you are entering this website solely based on your initiative and not as a result of any specific marketing outreach. You wish to obtain information from this website which is provided on reverse solicitation in accordance with the laws of your home jurisdiction.
Thank You for Your Acknowledgement!
Ten en cuenta que el sitio web está destinado a personas que residen en jurisdicciones donde el acceso al sitio web está permitido por la ley.
Ten en cuenta que PU Prime y sus entidades afiliadas no están establecidas ni operan en tu jurisdicción de origen.
Al hacer clic en el botón "Aceptar", confirmas que estás ingresando a este sitio web por tu propia iniciativa y no como resultado de ningún esfuerzo de marketing específico. Deseas obtener información de este sitio web que se proporciona mediante solicitud inversa de acuerdo con las leyes de tu jurisdicción de origen.
Thank You for Your Acknowledgement!
