PU Prime App
Exclusive deals on mobile


PU Prime App
Exclusive deals on mobile
Hold The Global Markets In Your Hands
Our trading mobile app is compatible with most smart devices. Download the App now and start trading with PU Prime on any device, anytime and anywhere.


20 December 2022,08:34
Trading Blog
20 December 2022, 08:34


Trading indicators are widely used in gold trading to derive insights from historical data so that these gold traders could make predictions about gold price movements. Hence, here are the best trading indicators for gold you need to know and master.
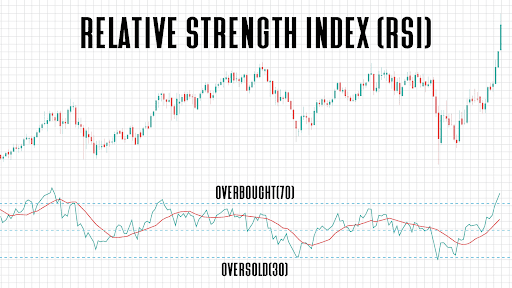
The Relative Strength Index (RSI) trading indicator measures short-term asset price fluctuations and is used to determine when it would be a good time to buy or sell an asset. In gold trading, the most favourable situation would be when RSI stays above 30 and hits 70 occasionally. A RSI level that falls below 30 generates buy signals as it suggests that the gold asset is being oversold. On the contrary, if the RSI level rises above 70, it suggests that the asset is being overbought and generates sell signals.
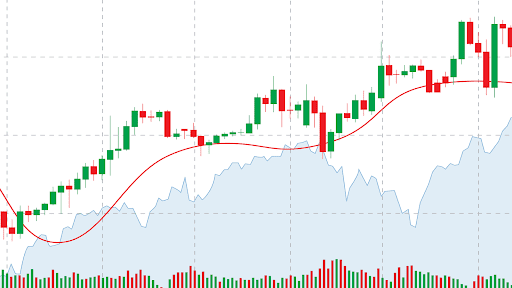
Moving averages (MA) can be calculated by dividing a range of prices by the number of periods happening in the selected range. The moving averages (MA) trading indicator helps gold traders to understand whether the gold asset prices are following an uptrend or downtrend, so that they could make decisions to sell or buy more assets.
There are two types of MA trading indicators; the exponential moving averages (EMA) and the simple moving averages (SMA) indicators. A trader can determine the better MA indicator to use based on their own trading objectives and preferences. EMA focuses more on the recent asset prices whereas SMA assigns equal weighing to all price values. The moving averages indicator can be seen as the red curved line in the image below.
You may also want to read more about Moving Averages here.
The Bollinger Bands indicator refers to a pair of trend lines used in conjunction with the moving averages indicator to indicate the standard deviation of asset prices from time to time. By using this trading indicator in their technical analysis, gold traders can gain a sense of whether gold prices are high or low on a relative and how volatile the asset market is. The upper band of bollinger bands can be seen as the green line whereas the lower band can be seen as the yellow line in the image below.
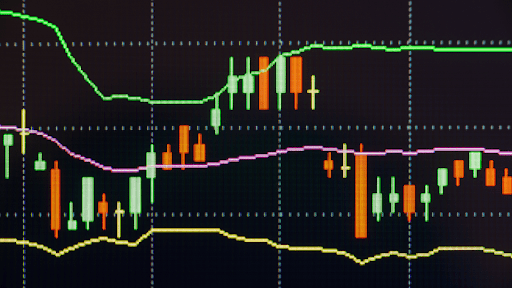
Because prices tend to bounce off the upper and lower bounds of the Bollinger Bands, gold traders use them to determine entry and exit points of gold trades. Prices hitting the upper bollinger band is signalling that the asset may be overbought, while prices hitting the lower bollinger band gives a buy signal as it means that the asset may be oversold. Gold traders usually open or close gold trades when its prices hit either one of the Bollinger bands.
It is definitely easier to plan your next steps in gold trading when you know what are the best trading indicators for gold you could use in technical analysis. For beginner gold traders that find technical analysis hard to do, they can consider getting started with a demo account to get themselves familiar with gold trading and the platform. Try out PU Prime’s demo account and master the concept of trading gold today.

Trade forex, indices, metal, and more at industry-low spreads and lightning-fast execution.
Sign up for a PU Prime Live Account with our hassle-free process.
Effortlessly fund your account with a wide range of channels and accepted currencies.
Access hundreds of instruments under market-leading trading conditions.
Trading Platforms
Education
Company
FAQs
PU Prime App - Start Trading with an Edge


Risk Warning: Trading Contract for Difference (CFD) carries a high level of risk to your capital and may result in losses that exceed your deposits due to leverage. It's important to understand how CFDs work and assess whether you can afford the high risk of losing your money. When acquiring our derivative products, you do not own or have rights in the underlying assets. Past performance is not indicative of future results. The information on this website is general and does not take into account your personal objectives, financial circumstances, or needs. Seek independent advice from qualified experts if necessary, and ensure you fully understand the risks before making any trading decisions.
PU Prime is a brand name of different entities authorised and registered in various jurisdictions.
PU Prime Limited is authorized and regulated by the Financial Services Authority of Seychelles under License No. SD050, with registered address at CT House, Office 1A, Providence, Mahe, Seychelles.
PU Prime Ltd is authorized and regulated by the Financial Services Commission of Mauritius under License No. GB23202672, with registered address at Suite 201 Level 2, The Catalyst Building, 40 Silicon Avenue, Cybercity Ebene, Mauritius.
PU Prime (Pty) Ltd is an authorised Financial Services Provider registered and regulated by the Financial Sector Conduct Authority of South Africa under License No. 52218, with registered address at 37 Harley Street, Ferndale, Randburg, Gauteng, South Africa.
The information on this website is not intended for residents of certain jurisdictions, including the United States, Singapore, Australia, China, Russia, and jurisdictions listed on the FATF and EU/UN sanctions lists. It is not intended for distribution or use where such distribution or use would be contrary to local law or regulation. While the Authority has granted a securities or derivatives investment business licence to the Licensee, it does not endorse the products offered.
Finzero Cap Ltd, registered in the Republic of Cyprus with registration number HE414308 and registered address at 62 Athalassas, Mezzanine, Strovolos 2012, Nicosia, Cyprus, acts as a payment agent to facilitate payment services for PU Prime.
Copyright © 2024 PU Prime.

Please note the Website is intended for individuals residing in jurisdictions where accessing the Website is permitted by law.
Please note that PU Prime and its affiliated entities are neither established nor operating in your home jurisdiction.
By clicking the "Acknowledge" button, you confirm that you are entering this website solely based on your initiative and not as a result of any specific marketing outreach. You wish to obtain information from this website which is provided on reverse solicitation in accordance with the laws of your home jurisdiction.
Thank You for Your Acknowledgement!
Ten en cuenta que el sitio web está destinado a personas que residen en jurisdicciones donde el acceso al sitio web está permitido por la ley.
Ten en cuenta que PU Prime y sus entidades afiliadas no están establecidas ni operan en tu jurisdicción de origen.
Al hacer clic en el botón "Aceptar", confirmas que estás ingresando a este sitio web por tu propia iniciativa y no como resultado de ningún esfuerzo de marketing específico. Deseas obtener información de este sitio web que se proporciona mediante solicitud inversa de acuerdo con las leyes de tu jurisdicción de origen.
Thank You for Your Acknowledgement!
